—
Plot the chemical equilibrium of a given initial solution.#
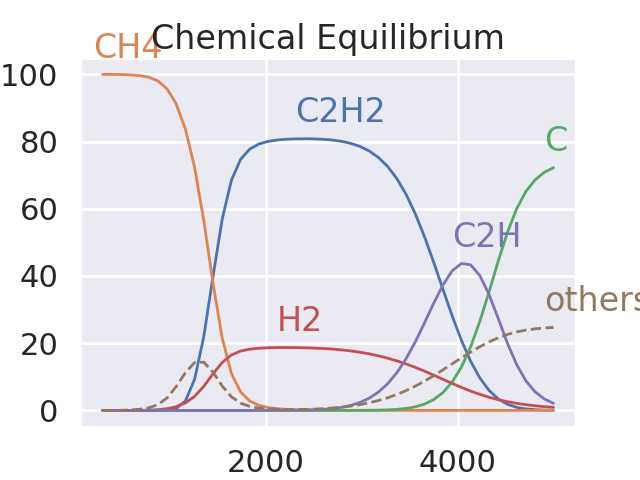
The script uses the plot_chemical_equilibrium function from rizer.misc.ct_utils to plot the main species under thermochemical equilibrium with Cantera.
Import the required libraries.#
import numpy as np

from rizer.misc.ct_utils import plot_chemical_equilibrium
from rizer.misc.plt_utils import set_mpl_style

set_mpl_style(nb_columns=1)
Plot the chemical equilibrium.#
The function plot_chemical_equilibrium plots the main species under thermochemical equilibrium with Cantera.
The function receives the following parameters:
thermo: Cantera thermo file.
initial_solution: Initial solution.
temperatures: Temperatures to evaluate.
unit: Temperature unit (“K” or “C”).
keep_only_first_species: Keep only the n first species.
save_file_name: Save file name.
fraction: Mole or mass fraction (“mole” or “mass”)
plot_chemical_equilibrium(
    thermo="gri30.yaml",
    initial_solution="CH4:1",
    unit="K",
    temperatures=np.linspace(300, 5000),
    keep_only_first_species=5,
    fraction="mass",
)
/home/runner/work/rizer/rizer/rizer/misc/ct_utils.py:124: UserWarning: ChemEquil::equilibrate: Temperature (3081.6326530612255 K) outside valid range of 300 K to 3000 K
  gas.equilibrate("TP")
/home/runner/work/rizer/rizer/rizer/misc/ct_utils.py:124: UserWarning: ChemEquil::equilibrate: Temperature (3177.551020408164 K) outside valid range of 300 K to 3000 K
  gas.equilibrate("TP")
/home/runner/work/rizer/rizer/rizer/misc/ct_utils.py:124: UserWarning: ChemEquil::equilibrate: Temperature (3273.4693877551035 K) outside valid range of 300 K to 3000 K
  gas.equilibrate("TP")
/home/runner/work/rizer/rizer/rizer/misc/ct_utils.py:124: UserWarning: ChemEquil::equilibrate: Temperature (3369.3877551020396 K) outside valid range of 300 K to 3000 K
  gas.equilibrate("TP")
/home/runner/work/rizer/rizer/rizer/misc/ct_utils.py:124: UserWarning: ChemEquil::equilibrate: Temperature (3465.306122448979 K) outside valid range of 300 K to 3000 K
  gas.equilibrate("TP")
/home/runner/work/rizer/rizer/rizer/misc/ct_utils.py:124: UserWarning: ChemEquil::equilibrate: Temperature (3561.2244897959154 K) outside valid range of 300 K to 3000 K
  gas.equilibrate("TP")
/home/runner/work/rizer/rizer/rizer/misc/ct_utils.py:124: UserWarning: ChemEquil::equilibrate: Temperature (3657.142857142854 K) outside valid range of 300 K to 3000 K
  gas.equilibrate("TP")
/home/runner/work/rizer/rizer/rizer/misc/ct_utils.py:124: UserWarning: ChemEquil::equilibrate: Temperature (3753.0612244897984 K) outside valid range of 300 K to 3000 K
  gas.equilibrate("TP")
/home/runner/work/rizer/rizer/rizer/misc/ct_utils.py:124: UserWarning: ChemEquil::equilibrate: Temperature (3848.9795918367327 K) outside valid range of 300 K to 3000 K
  gas.equilibrate("TP")
/home/runner/work/rizer/rizer/rizer/misc/ct_utils.py:124: UserWarning: ChemEquil::equilibrate: Temperature (3944.897959183674 K) outside valid range of 300 K to 3000 K
  gas.equilibrate("TP")
/home/runner/work/rizer/rizer/rizer/misc/ct_utils.py:124: UserWarning: ChemEquil::equilibrate: Temperature (4040.8163265306134 K) outside valid range of 300 K to 3000 K
  gas.equilibrate("TP")
/home/runner/work/rizer/rizer/rizer/misc/ct_utils.py:124: UserWarning: ChemEquil::equilibrate: Temperature (4136.7346938775545 K) outside valid range of 300 K to 3000 K
  gas.equilibrate("TP")
/home/runner/work/rizer/rizer/rizer/misc/ct_utils.py:124: UserWarning: ChemEquil::equilibrate: Temperature (4232.6530612244915 K) outside valid range of 300 K to 3000 K
  gas.equilibrate("TP")
/home/runner/work/rizer/rizer/rizer/misc/ct_utils.py:124: UserWarning: ChemEquil::equilibrate: Temperature (4328.571428571432 K) outside valid range of 300 K to 3000 K
  gas.equilibrate("TP")
/home/runner/work/rizer/rizer/rizer/misc/ct_utils.py:124: UserWarning: ChemEquil::equilibrate: Temperature (4424.48979591837 K) outside valid range of 300 K to 3000 K
  gas.equilibrate("TP")
/home/runner/work/rizer/rizer/rizer/misc/ct_utils.py:124: UserWarning: ChemEquil::equilibrate: Temperature (4520.408163265303 K) outside valid range of 300 K to 3000 K
  gas.equilibrate("TP")
/home/runner/work/rizer/rizer/rizer/misc/ct_utils.py:124: UserWarning: ChemEquil::equilibrate: Temperature (4616.326530612244 K) outside valid range of 300 K to 3000 K
  gas.equilibrate("TP")
/home/runner/work/rizer/rizer/rizer/misc/ct_utils.py:124: UserWarning: ChemEquil::equilibrate: Temperature (4712.244897959182 K) outside valid range of 300 K to 3000 K
  gas.equilibrate("TP")
/home/runner/work/rizer/rizer/rizer/misc/ct_utils.py:124: UserWarning: ChemEquil::equilibrate: Temperature (4808.163265306119 K) outside valid range of 300 K to 3000 K
  gas.equilibrate("TP")
/home/runner/work/rizer/rizer/rizer/misc/ct_utils.py:124: UserWarning: ChemEquil::equilibrate: Temperature (4904.081632653061 K) outside valid range of 300 K to 3000 K
  gas.equilibrate("TP")
/home/runner/work/rizer/rizer/rizer/misc/ct_utils.py:124: UserWarning: ChemEquil::equilibrate: Temperature (5000.000000000004 K) outside valid range of 300 K to 3000 K
  gas.equilibrate("TP")
Total running time of the script: (0 minutes 0.861 seconds)