—
Plot mass enthalpy vs. temperature for methane and hydrogen.#
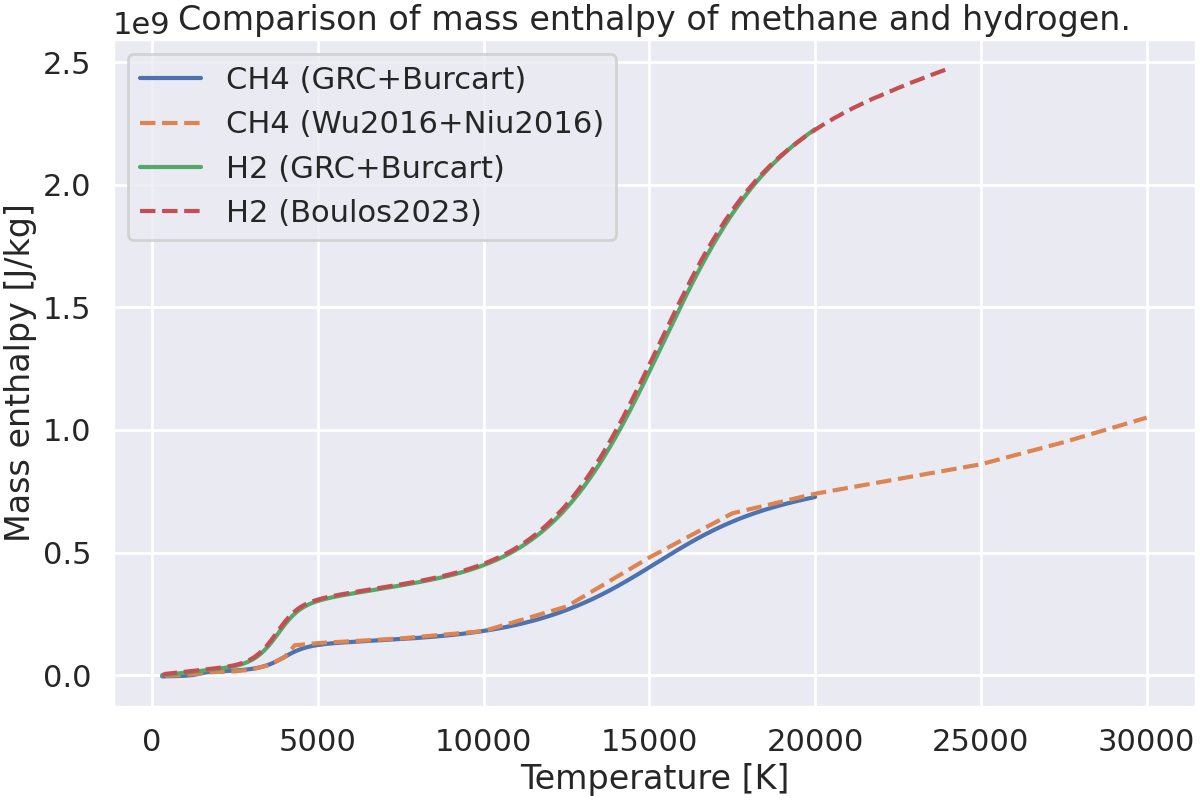
This example shows how to compute and plot the mass enthalpy of methane and hydrogen as a function of temperature. Two cases are considered: pure methane and pure hydrogen.
Equilibrium composition#
The following species are considered in the mechanism:
H, H2, C, CH, CH2, CH3, CH4, C2, C2H, C2H2, C2H3, C2H4, C2H5, C2H6,
corresponding ions,
electrons,
no solid carbon species.
Data comes from the following sources:
[GRCDatabase] for neutral species, C+, C2+, CH+, H+ and H2+, and for electrons,
[Burcat] for the other ions.
The thermo data are given as NASA 9 polynomial coefficients (For details, see https://cantera.org/stable/reference/thermo/species-thermo.html#the-nasa-9-coefficient-polynomial-parameterization).
The temperature range is from 200 to 20000 K for atomic species, and from 200 to 6000 K for molecular species.
Then, to compute the equilibrium composition of the plasma, the Gibbs free energy minimization method is used.
Computations are performed at a pressure of 1 atm, using Cantera, and compared to data from the following sources:
Hydrogen: [Boulos2023]
Import the required libraries.#
import cantera as ct
import matplotlib.pyplot as plt
import numpy as np
import seaborn as sns

from rizer.io.thermo_transport_data_reader import ThermoTransportDataReader
from rizer.misc.utils import get_path_to_data

sns.set_theme("poster")
Define the thermo data files to load.#
mechanism = get_path_to_data("mechanisms", "Goutier2025", "CH4_to_C2H2.yaml")

# Load the gas phase.
gas = ct.Solution(
    mechanism,
    name="gas",
    transport_model=None,
)
Define the temperature range.#
temperatures = np.linspace(300, 20000, 1000)
Compute the mass enthalpy.#
states = ct.SolutionArray(gas)
states2 = ct.SolutionArray(gas)

for i, T in enumerate(temperatures):
    gas.TPX = T, ct.one_atm, "CH4:1"
    gas.equilibrate("TP")
    states.append(gas.state)
    gas.TPX = T, ct.one_atm, "H2:1"
    gas.equilibrate("TP")
    states2.append(gas.state)
Load thermodynamic and transport data.#
data_CH4 = ThermoTransportDataReader(
    gas_name="CH4",
    pressure_atm=1,
    source="Wu2016_Niu2016",
    skip_missing_values=True,
)

data_H2 = ThermoTransportDataReader(
    gas_name="H2",
    pressure_atm=1,
    source="Boulos2023",
)
Plot the mass enthalpy vs. temperature.#
fig, ax = plt.subplots(figsize=(12, 8), layout="constrained")
ax.plot(temperatures, states.enthalpy_mass, label="CH4 (GRC+Burcart)")
ax.plot(data_CH4.temperature, data_CH4.enthalpy, "--", label="CH4 (Wu2016+Niu2016)")
ax.plot(temperatures, states2.enthalpy_mass, label="H2 (GRC+Burcart)")
ax.plot(data_H2.temperature, data_H2.enthalpy, "--", label="H2 (Boulos2023)")
ax.set_xlabel("Temperature [K]")
ax.set_ylabel("Mass enthalpy [J/kg]")
ax.set_title("Comparison of mass enthalpy of methane and hydrogen.")
ax.legend()
plt.show()
Total running time of the script: (0 minutes 0.540 seconds)