—
Plot specific heat vs. temperature for different species and thermo data.#
This example demonstrates how to plot the specific heat of different species vs. temperature for different thermo data files.
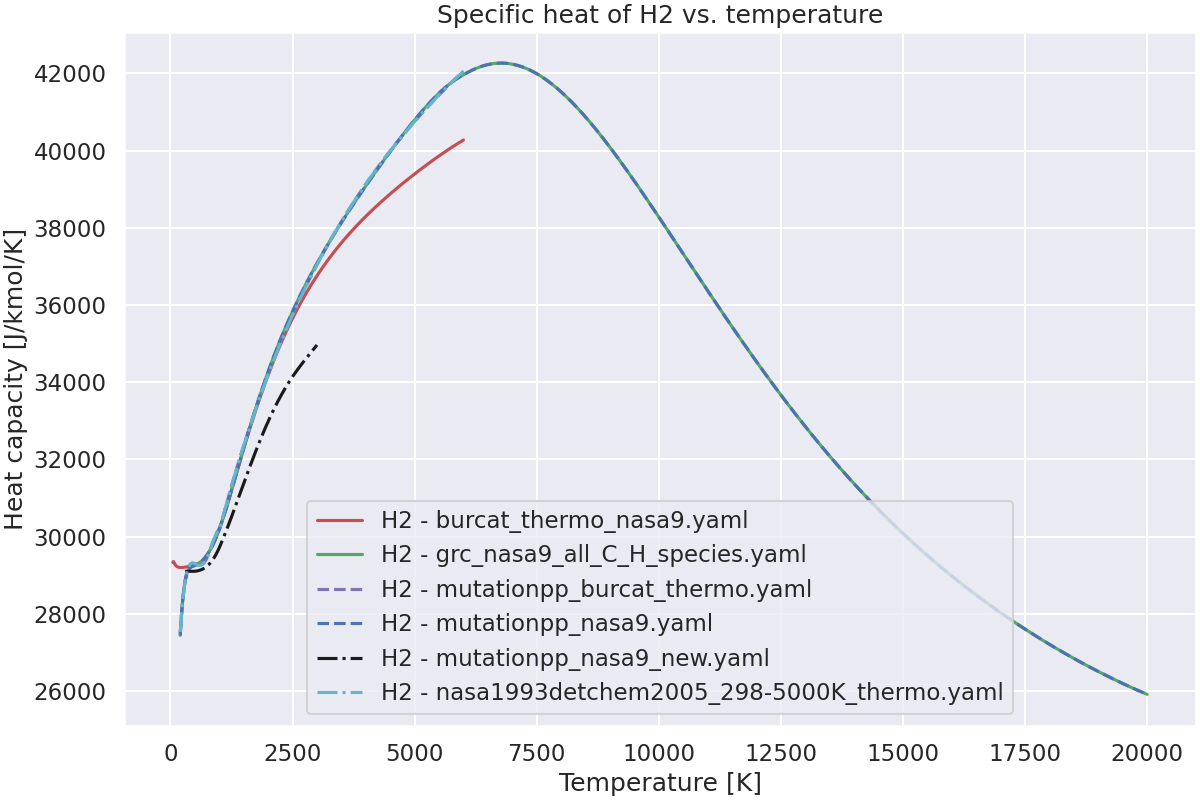
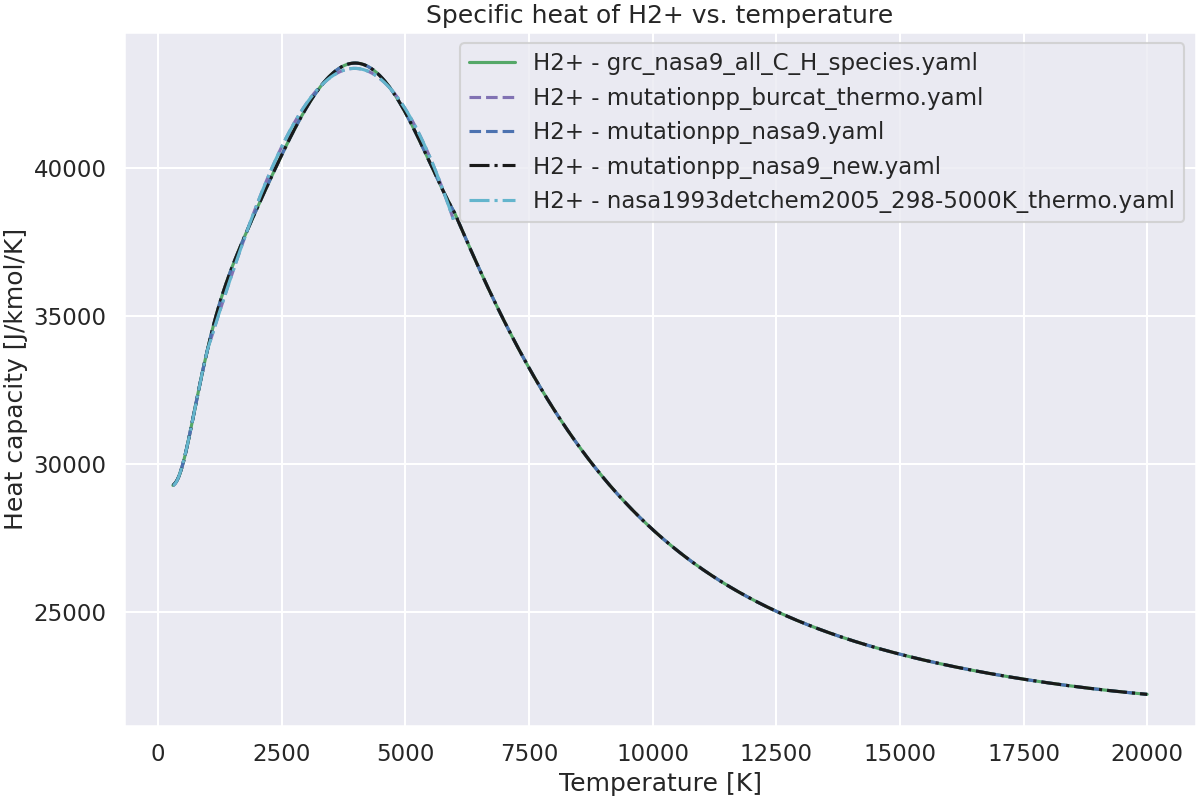
The specific heat of a species is a function of temperature. The specific heat is the amount of heat required to raise the temperature of a unit mass of a substance by one degree Kelvin.
Here, the specific heat is in J/kmol/K, and the temperature is in Kelvin.
# This is an option for the online documentation, so that each image is displayed separately.
# sphinx_gallery_multi_image = "single"
Import the required libraries.#
import cantera as ct
import matplotlib.pyplot as plt
import numpy as np

from rizer.misc.plt_utils import set_mpl_style
from rizer.misc.utils import get_path_to_data

set_mpl_style(nb_columns=1)
Define the thermo data files to load.#
# Dictionary to store thermo data files.
# Key: name of the thermo data file.
# Value: color and linestyle, to use in the plot.
thermo_data: dict[str, str] = {
    "burcat_thermo_nasa9.yaml": "r",
    "grc_nasa9_C_H.yaml": "g",
    "deprecated/mutationpp_burcat_nasa7_thermo.yaml": "m--",
    "deprecated/mutationpp_nasa9.yaml": "b--",
    "deprecated/mutationpp_nasa9_new.yaml": "k-.",
    "deprecated/nasa1993detchem2005_298-5000K_thermo.yaml": "c-.",
}
Set the species to plot.#
# Dictionary to store species data.
# Key: species name
# Value: dictionary with:
#   key: name of the thermo data
#   value: Cantera Species object
species_to_plot: dict[str, dict[str, ct.Species]] = {
    "CH4": {},
    "CH4+": {},
    "C2H2": {},
    "C2H2+": {},
    "H2": {},
    "H2+": {},
}
Load species data from the various mechanisms.#
for thermo in thermo_data:
    # Load species data.
    path_to_species = get_path_to_data("mechanisms/thermo", thermo)
    species_list: list[ct.Species] = ct.Species.list_from_file(str(path_to_species))

    # Look up for matching species in the list.
    for species_name in species_to_plot:
        for specie in species_list:
            if specie.name == species_name:
                species_to_plot[species_name][thermo] = specie
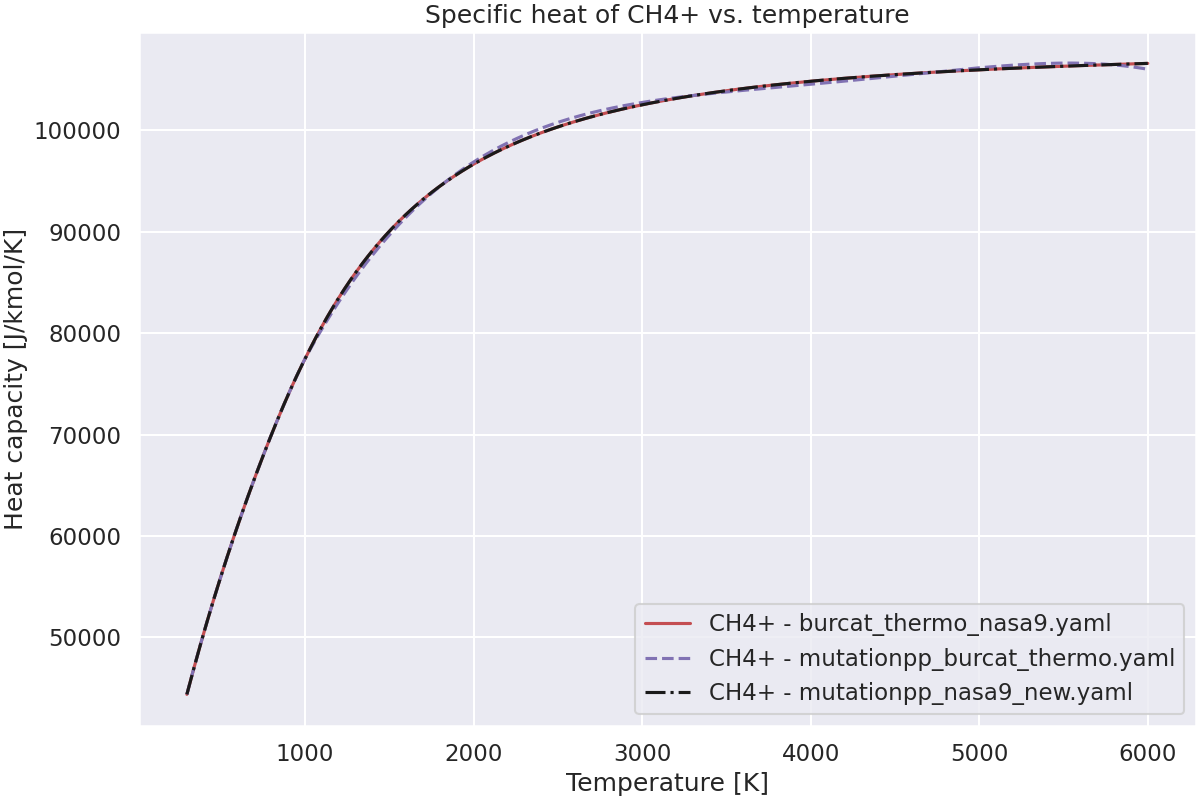
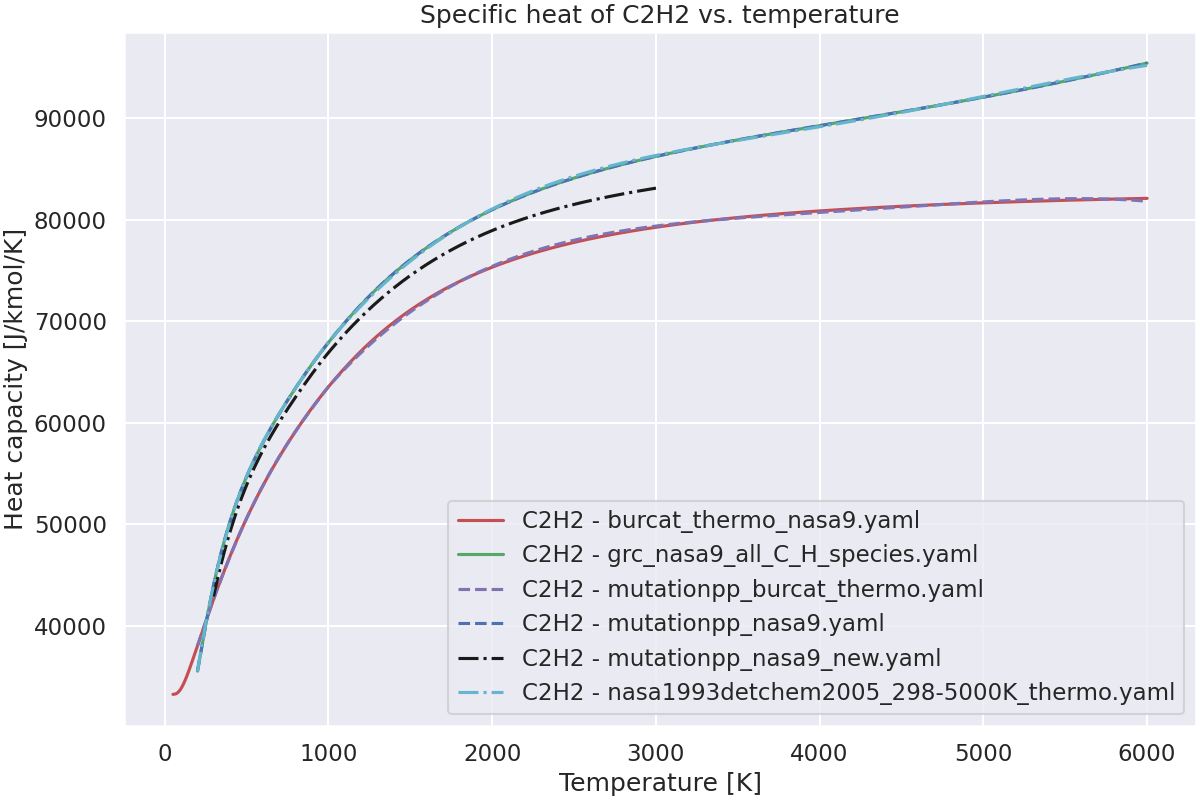
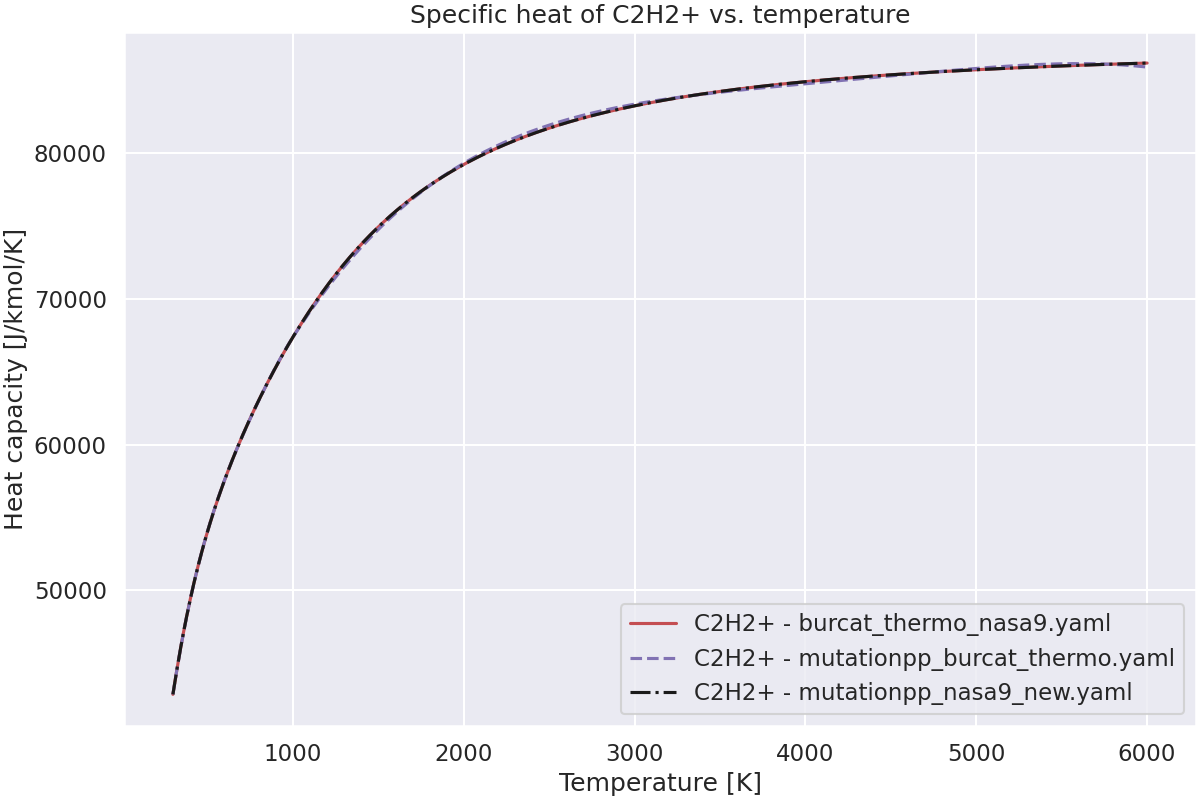
Plot the specific heat of the species vs. temperature.#
# For each species, plot the specific heat vs. temperature.
for species_name in species_to_plot:
    fig, ax = plt.subplots()

    for thermo in thermo_data:
        # Check if the species is present in the thermo data.
        if thermo not in species_to_plot[species_name]:
            print(
                f"Species {species_name} not found in {thermo}."
                "Check spelling and composition."
            )
            continue

        # Get the species object.
        species = species_to_plot[species_name][thermo]
        # Define the temperature range.
        min_temperature = species.thermo.min_temp
        max_temperature = species.thermo.max_temp
        temperatures = np.linspace(min_temperature, max_temperature, num=1000)  # K
        # Compute the specific heat for each temperature.
        cp = np.array([species.thermo.cp(T) for T in temperatures])  # J/kmol/K

        # Plot the specific heat vs. temperature.
        color = thermo_data[thermo]
        ax.plot(temperatures, cp, color, label=f"{species_name} - {thermo}")
        ax.set_title(f"Specific heat of {species_name} vs. temperature")

    # Set the labels and legend.
    ax.set_xlabel("Temperature [K]")
    ax.set_ylabel("Heat capacity [J/kmol/K]")

    # Plot
    plt.legend()
    plt.show()
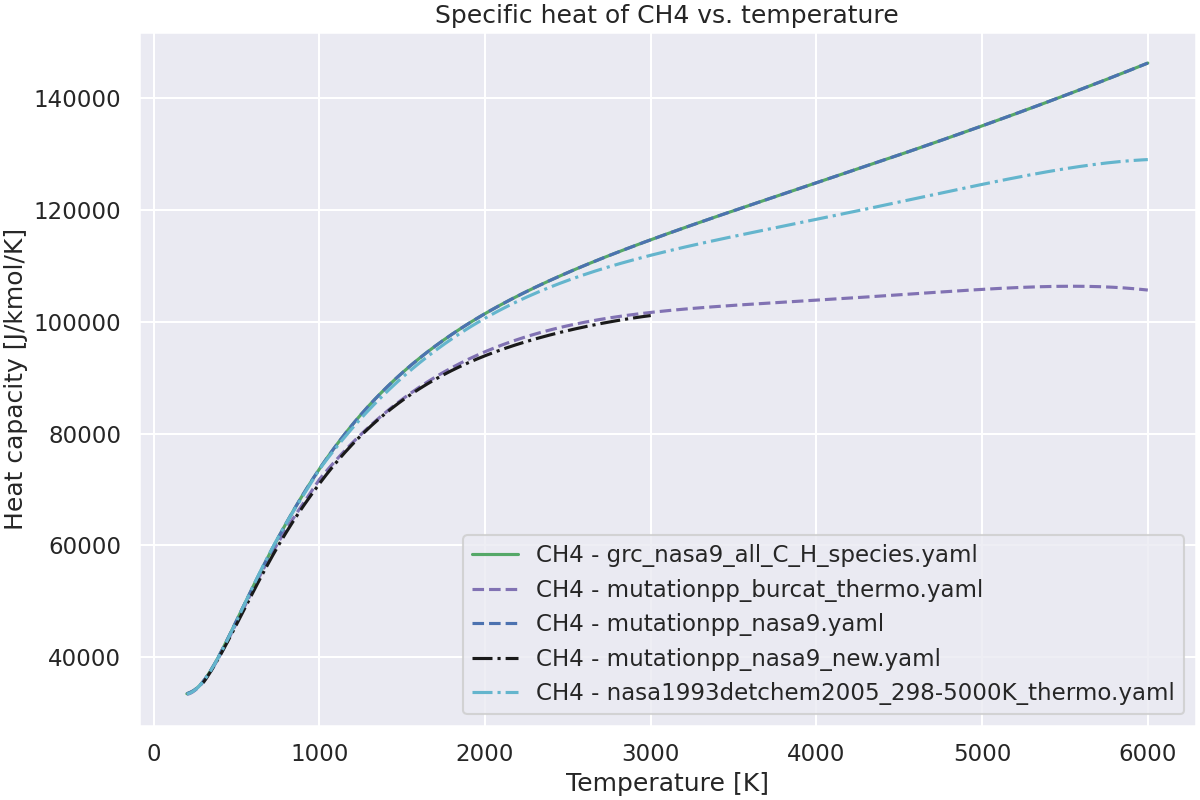
Species CH4 not found in burcat_thermo_nasa9.yaml.Check spelling and composition.
Species CH4+ not found in grc_nasa9_C_H.yaml.Check spelling and composition.
Species CH4+ not found in deprecated/mutationpp_nasa9.yaml.Check spelling and composition.
Species CH4+ not found in deprecated/nasa1993detchem2005_298-5000K_thermo.yaml.Check spelling and composition.
Species C2H2+ not found in grc_nasa9_C_H.yaml.Check spelling and composition.
Species C2H2+ not found in deprecated/mutationpp_nasa9.yaml.Check spelling and composition.
Species C2H2+ not found in deprecated/nasa1993detchem2005_298-5000K_thermo.yaml.Check spelling and composition.
Species H2+ not found in burcat_thermo_nasa9.yaml.Check spelling and composition.
Total running time of the script: (0 minutes 4.494 seconds)