
Note
Go to the end to download the full example code.
Analysis of Philippe Castera’s circuit.#
Reproducing the results of Philippe Castera’s thesis [Castera2015].
The circuit solved is the following (see figure 4.2.1 in [Castera2015]):
 ┌-------------------(L-L_p)------┐
 │       ↑  │                     │
 │      u_c C                    L_p
R_b      │  │                     │
 │         R_sg                  R_p(t)
 │          │                     │
 ┖--------------------------------┘
where:
\(C\) is the capacitance of the capacitor,
\(R_b\) is the resistance of the ballast resistor,
\(R_sg\) models the wires and sparkgap resistances,
\(R_p(t)\) is the time-varying resistance of the plasma,
\(L_p\) is the stray inductance related to the plasma channel and the wiring between the connection points of the voltage probe.
The plasma resistance is modeled here by following the Rompe-Weizel model:
Import the required libraries.#
import matplotlib.pyplot as plt
import numpy as np

from rizer.electrical_model.circuit.castera_circuit import CasteraCircuit
from rizer.electrical_model.components.plasma_load import RompeWeizelResistance
from rizer.misc.plt_utils import set_mpl_style
from rizer.misc.utils import get_path_to_data

set_mpl_style(nb_columns=1)

path_to_data = get_path_to_data("papers", "CasteraThesis")
Define the circuit and resistance model parameters.#
Circuit parameters are taken from the legend of figure 4.2.2 in [Castera2015].
C = 14.5e-9  # F
L = 0.8e-6  # H
L_p = 0  # H
R_b = 1.7e3  # Ohm
R_sg = 0.79  # Ohm

# Initial conditions.
I_0 = 0  # A, read on fig 4.2.2 + in equation 4.2.1.
R_0 = 120  # Ohm, from fig 4.3.8.

# Rompe-Weizel resistance parameters.
gap = 95e-3  # m, case A of Castera's thesis.
k_RW = 26  # V . s^(1/2) . m^(-1), for air from section 4.3.1.
rw_resistance = RompeWeizelResistance(gap=gap, k_RW=k_RW)

# Time vector.
time = np.linspace(0, 1500e-9, 1000)
Solve the circuit for \(U_{c,0} = 19\) kV.#
U_c_0 = 19e3  # V
castera_circuit = CasteraCircuit(C, L, L_p, R_b, R_sg, R_0, I_0, U_c_0, rw_resistance)
i1, _, _, _ = castera_circuit.solve(time)
i1_norm = i1 / i1.max()

data = np.genfromtxt(
    path_to_data / "castera_fig4_2_2_19kV.csv", delimiter=",", skip_header=3
)
i_exp_norm = data[:, 1]  # -
time_exp = data[:, 0] * 1e-6  # s
i1_norm_interp = np.interp(time_exp, time, i1_norm, left=0, right=0)
Solve the circuit for \(U_{c,0} = 25\) kV.#
U_c_0 = 25e3  # V
castera_circuit2 = CasteraCircuit(C, L, L_p, R_b, R_sg, R_0, I_0, U_c_0, rw_resistance)
i2, _, _, _ = castera_circuit2.solve(time)
i2_norm = i2 / i2.max()

data = np.genfromtxt(
    path_to_data / "castera_fig4_2_2_25kV.csv", delimiter=",", skip_header=3
)
i_exp_norm2 = data[:, 1]  # -
time_exp2 = data[:, 0] * 1e-6  # s
i2_norm_interp = np.interp(time_exp2, time, i2_norm, left=0, right=0)
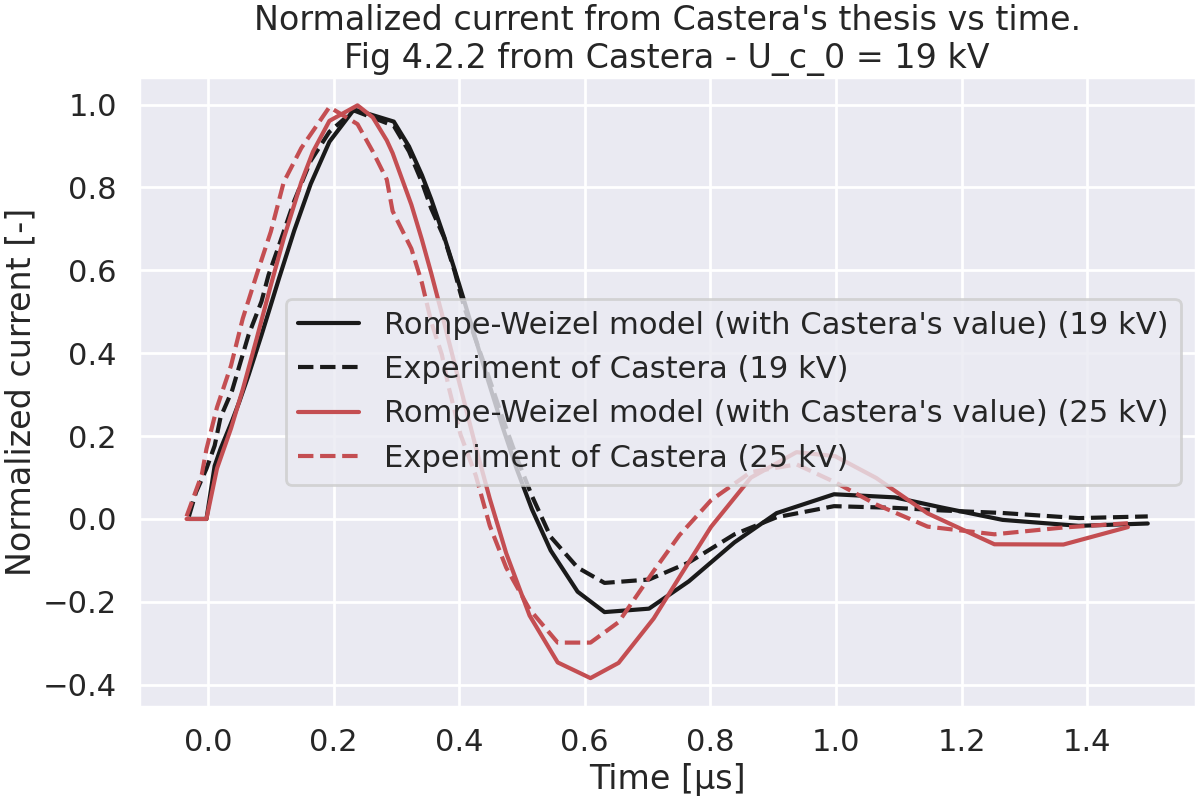
Plot figure 4.2.2.#
In this figure, the current is normalized by its maximum value.
fig, ax = plt.subplots()
ax.set_title(
    "Normalized current from Castera's thesis vs time.\n"
    "Fig 4.2.2 from Castera - U_c_0 = 19 kV"
)
ax.set_xlabel("Time [µs]")
ax.set_ylabel("Normalized current [-]")
ax.plot(
    time_exp * 1e6,
    i1_norm_interp,
    "k",
    label="Rompe-Weizel model (with Castera's value) (19 kV)",
)
ax.plot(time_exp * 1e6, i_exp_norm, "k--", label="Experiment of Castera (19 kV)")
ax.plot(
    time_exp2 * 1e6,
    i2_norm_interp,
    "r",
    label="Rompe-Weizel model (with Castera's value) (25 kV)",
)
ax.plot(time_exp2 * 1e6, i_exp_norm2, "r--", label="Experiment of Castera (25 kV)")
ax.legend(fontsize=16, loc="upper right")
plt.show()
Solve the circuit for figure 4.3.1.#
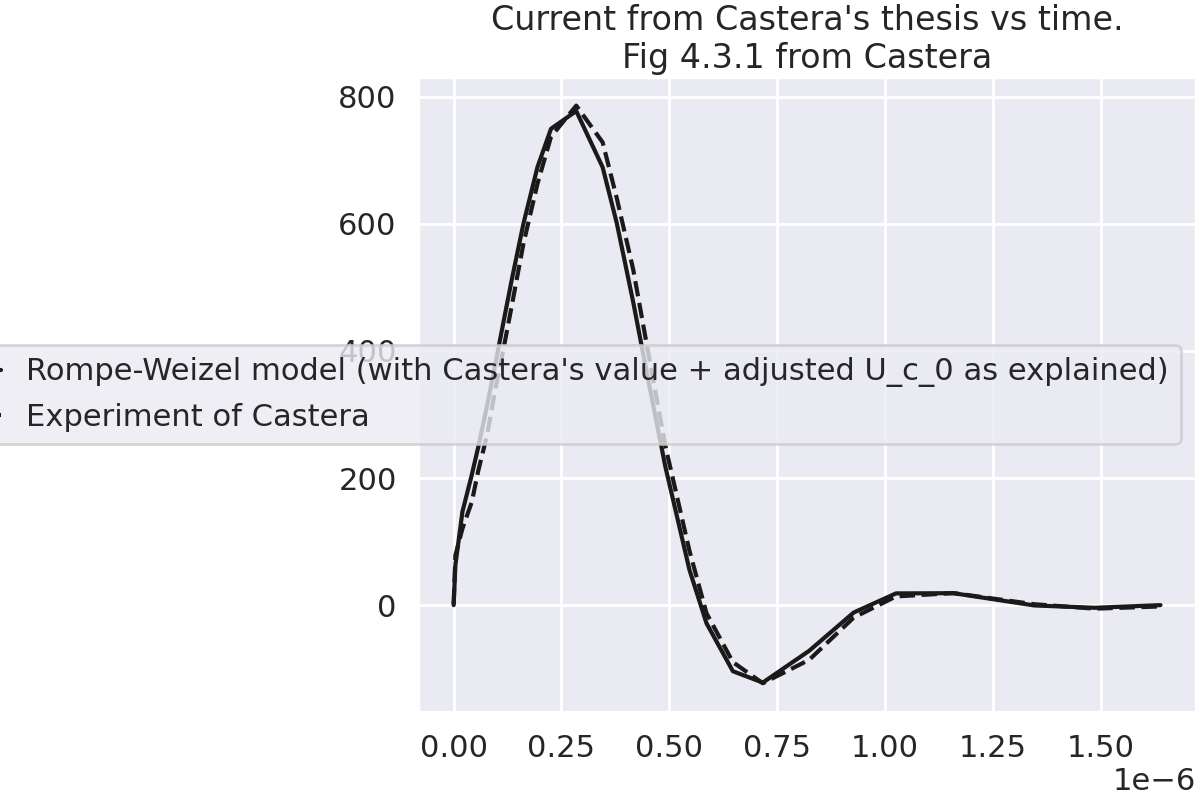
In this figure, the current is NOT normalized by its maximum value.
On fig 4.3.1, the initial voltage is 19.0 kV. However, in section 4.2.6, Castera writes that the initial voltage U0 is measured after the streamer phase that bridges the gap. Looking at figure 4.1.3, this corresponds to the voltage at time \(\tau_{RS}\). The voltage at this time is lower than the applied voltage.
Therefore, for fig 4.3.1, we set the initial voltage to 16.7 kV, for the best fit.
U_c_0 = 16.7e3  # V
castera_circuit = CasteraCircuit(C, L, L_p, R_b, R_sg, R_0, I_0, U_c_0, rw_resistance)
i, _, _, _ = castera_circuit.solve(time)

data = np.genfromtxt(
    path_to_data / "castera_fig4_3_1.csv",
    delimiter=",",
    skip_header=3,
)
i_exp = data[:, 1]  # -
time_exp = data[:, 0] * 1e-6  # s
i_interp = np.interp(time_exp, time, i, left=0, right=0)
Plot figure 4.3.1.#
fig, ax = plt.subplots()
ax.set_title("Current from Castera's thesis vs time.\nFig 4.3.1 from Castera")
ax.plot(
    time_exp,
    i_interp,
    "k",
    label="Rompe-Weizel model (with Castera's value + adjusted U_c_0 as explained)",
)
ax.plot(time_exp, i_exp, "k--", label="Experiment of Castera")
ax.legend(fontsize=16, loc="upper right")
plt.show()
Total running time of the script: (0 minutes 1.629 seconds)