Thermodynamic properties#
Methane and hydrogen thermodynamic properties in Local Thermal Equilibrium (LTE) for now, as well as composition at equilibrium for methane and hydrogen.
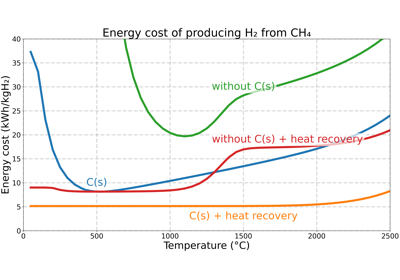
Plot the energy cost of producing H₂ from CH₄ as a function of temperature.
Plot the energy cost of producing H₂ from CH₄ as a function of temperature.
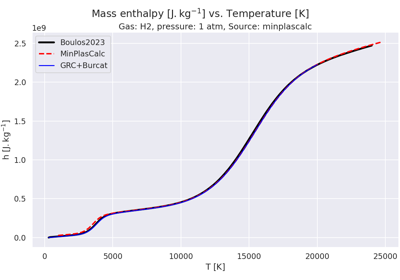
Plot thermodynamic properties of H₂ vs. temperatures.
Plot thermodynamic properties of H₂ vs. temperatures.
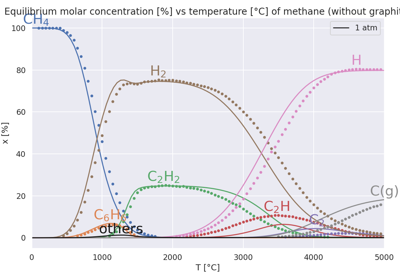
Plot CH₄ chemical equilibrium vs temperature for various pressures (including solid carbon).
Plot CH₄ chemical equilibrium vs temperature for various pressures (including solid carbon).
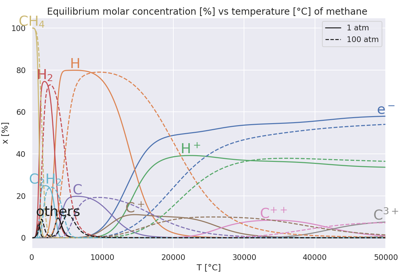
Plot CH₄ chemical equilibrium vs temperature for various pressures (at high temperatures).
Plot CH₄ chemical equilibrium vs temperature for various pressures (at high temperatures).
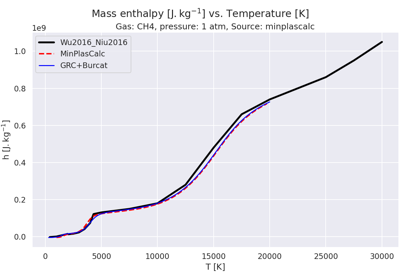
Plot thermodynamic properties of CH₄ vs. temperatures.
Plot thermodynamic properties of CH₄ vs. temperatures.
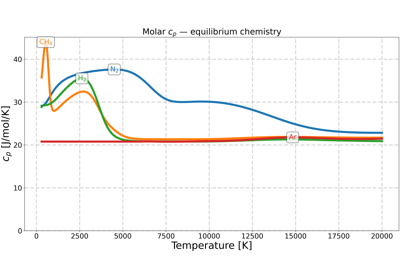
Plot molar heat capacity of N₂, CH₄, H₂ and Ar vs. temperature.
Plot molar heat capacity of N₂, CH₄, H₂ and Ar vs. temperature.
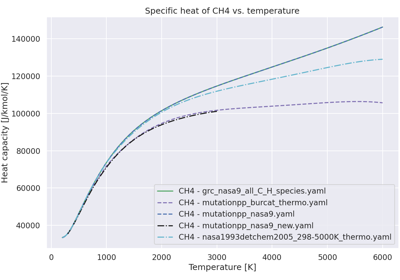
Plot specific heat vs. temperature for different species and thermo data.
Plot specific heat vs. temperature for different species and thermo data.