Examples#
You will find below a series of runnable examples using Rizer.
All examples can be run directly from Codespace.
See also
To find examples covering a specific topic, see the index of example tags.
Cantera#
[Cantera] related examples.
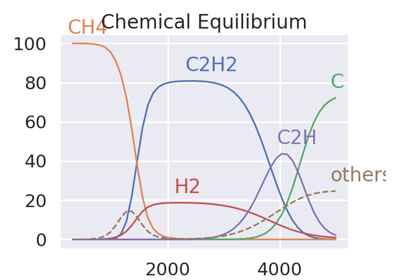
Plot the chemical equilibrium of a given initial solution.

Interactive Reaction Path Diagrams for CH₄ plasma chemistry.
Input/Output#
Examples related to input and output operations, like how to read and write chemical kinetic data in various formats.

Computing and comparing the properties of an CH_4 plasma.

Generates Janev cross section in LXCat format (understandable by Bolsig+).

Generates Janev hydrogen cross section in LXCat format (understandable by Bolsig+).

Example: Calculating the properties of an CH_4 plasma.

Generates minplascalc JSON files for monatomic, diatomic and polyatomic species.

Generate NASA9 coefficients for the electronic excited states of an atom.
Kinetics#
Kinetics related examples, like how to build a chemical mechanism with electrons and visualizing reaction path diagrams.
Add CHEMKIN transport data to a Cantera YAML file.
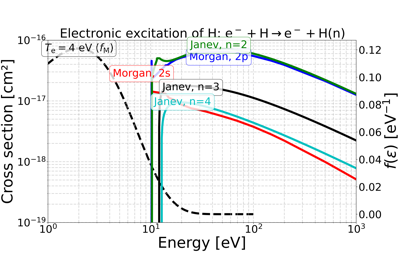
Plot electron-impact cross sections for atomic hydrogen.
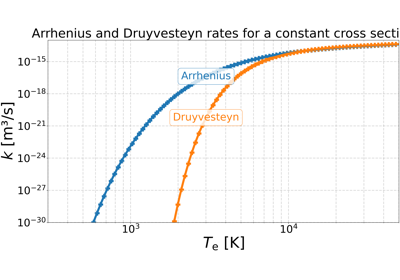
Plot Arrhenius and Druyvesteyn rates for a given cross section.
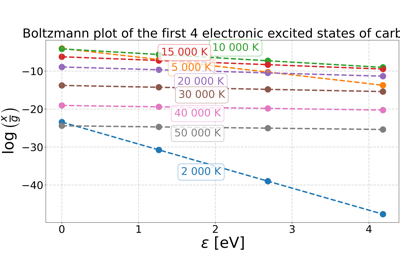
Boltzmann plot of the first electronic excited states of carbon.

Run Bolsig to compute energy fraction loss in CH₄.
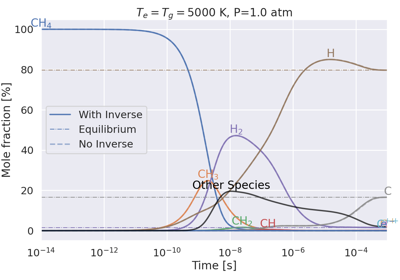
Do we get the same equilibrium with and without inverse reactions?
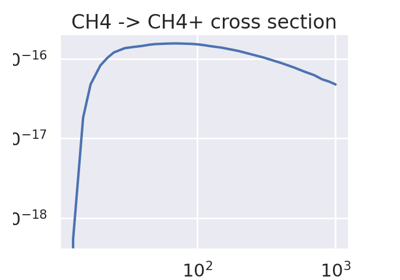
Cross sections and reaction rate constant for the ionisation of CH₄ by electrons.
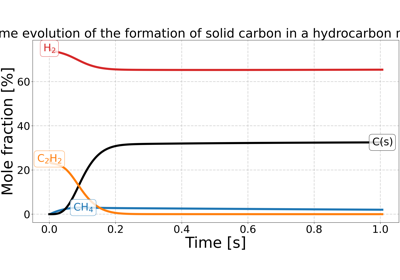
Time evolution of the formation of solid carbon in a hydrocarbon mixture.

Mechanism#
Mechanism related examples, like building Goutier2025.yaml

Compute and write dissociative recombination of hydrocarbons.

Cross sections and reaction rate constants for the electron impact of hydrocarbon.

Build ion-neutral reactions from UMIST into a Cantera YAML file.

Build reverse electronic reaction into a Cantera YAML file.
Plasma#
Could be NRP plasma, DC plasma, hybrid plasma, or discharge plasma examples.
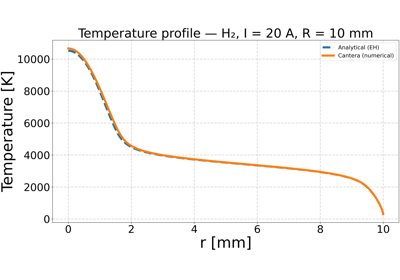
Elenbaas-Heller model for H₂ DC plasma — Cantera numerical solver.
Plot CH₄ average momentum transfer collision frequency.
Plot CH₄ average and elastic momentum transfer cross sections.

Use Stine-Watson model for a DC thermal plasma in H₂.
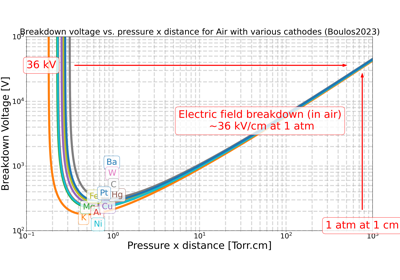
Radiation properties#
Methane and hydrogen radiation properties in Local Thermal Equilibrium (LTE), using the Net Emission Coefficient (NEC) method for now.
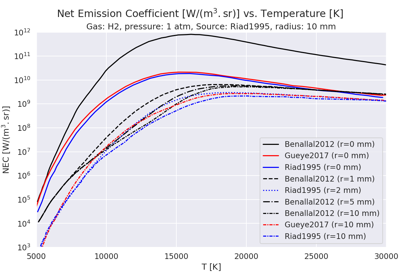
Plot radiation data vs. temperature for CH4, H2 and N2.
Thermodynamic properties#
Methane and hydrogen thermodynamic properties in Local Thermal Equilibrium (LTE) for now, as well as composition at equilibrium for methane and hydrogen.
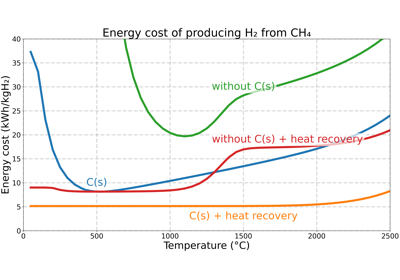
Plot the energy cost of producing H₂ from CH₄ as a function of temperature.
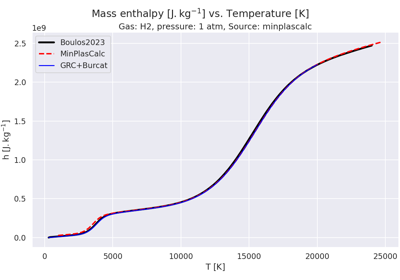
Plot thermodynamic properties of H₂ vs. temperatures.
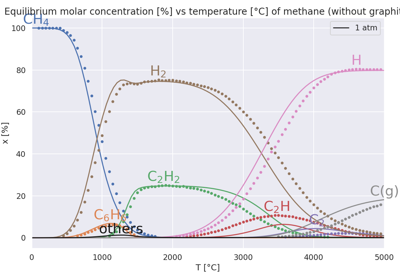
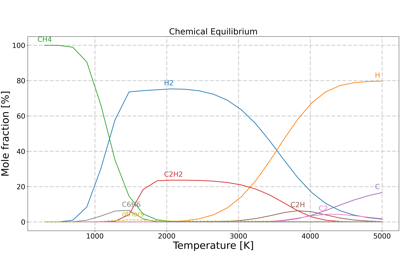
Plot CH₄ chemical equilibrium vs temperature for various pressures (including solid carbon).
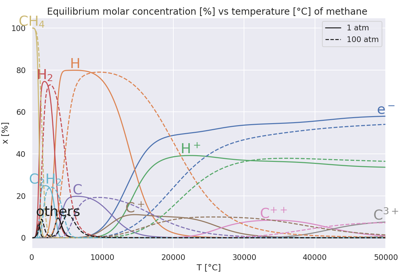
Plot CH₄ chemical equilibrium vs temperature for various pressures (at high temperatures).
Plot thermodynamic properties of CH₄ vs. temperatures.
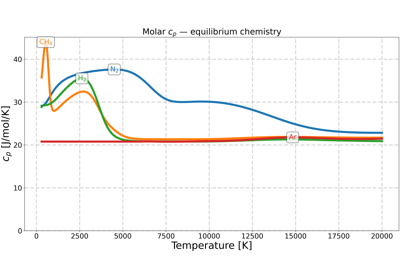
Plot molar heat capacity of N₂, CH₄, H₂ and Ar vs. temperature.
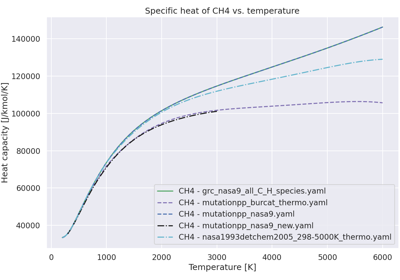
Plot specific heat vs. temperature for different species and thermo data.
Transport properties#
Methane and hydrogen transport properties in Local Thermal Equilibrium (LTE) for now.
Plot thermodynamic and transport data vs. temperature for a plasma of Air, O2 or N2 in LTE.
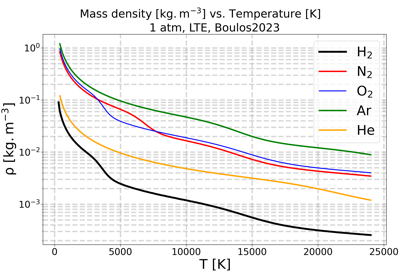
Plot thermodynamic and transport data vs. temperature for a plasma of H2, O2, N2, Ar, He in LTE.
Compare thermal conductivity vs. temperature for a plasma of methane.
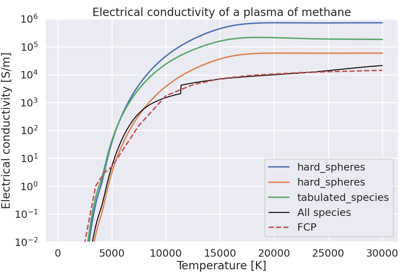
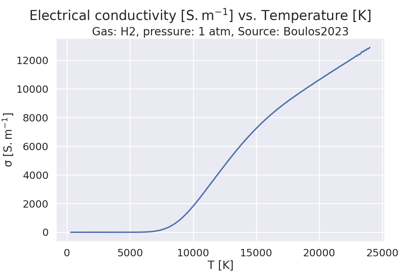
Plot electrical conductivity vs. temperature for a plasma of methane.
Plot transport data vs. temperature for a plasma of hydrogen.
Plot transport data vs. temperature for a plasma of methane.