—
Paschen curve for a Townsend discharge.#
This example plots the breakdown voltage as a function of the product of pressure and distance (pd) for a Townsend discharge in air with various cathode materials.
The breakdown voltage is calculated using the Townsend breakdown criterion, which depends on the first Townsend coefficient (alpha) and the secondary electron emission coefficient (gamma) for the given gas and cathode material.
Values for alpha and gamma are from [Boulos2023] for He, Ar, H2, H2O, CO2, Air, H2. For CH4, alpha is taken from J. Phys. D: Appl. Phys. 49 (2016) 415203 (13pp), http://dx.doi.org/10.1088/0022-3727/49/41/415203, and gamma is set to a default value of 1e-2 due to lack of data.
Import the required libraries.#
import matplotlib.pyplot as plt
import numpy as np
from adjustText import adjust_text

from rizer.misc.plt_utils import get_text, set_mpl_style
from rizer.misc.utils import get_path_to_data
from rizer.plasma.townsend_breakdown_discharge import (
    TownsendBreakdownDischarge,
    get_townsend_coefficients,
)

set_mpl_style(nb_columns=1)
Load experimental data for the breakdown voltage from [Raizer1991].#
experimental_gases_available = ["Air", "Ar", "H2", "He", "N2", "Ne"]
dict_experimental_data: dict[str, tuple[np.ndarray, np.ndarray]] = {}
for gas in experimental_gases_available:
    data = np.loadtxt(
        get_path_to_data(f"townsend_discharge/Raizer_fig7_2_breakdown_in_{gas}.csv"),
        delimiter=",",
        skiprows=3,
    )
    pd_data = data[:, 0]  # [Torr.cm]
    V_data = data[:, 1]  # [Volt]
    dict_experimental_data[gas] = (pd_data, V_data)

fig, ax = plt.subplots()
for gas, (pd_data, V_data) in dict_experimental_data.items():
    ax.plot(
        pd_data,
        V_data,
        "-",
    )
    get_text(
        pd_data[len(pd_data) // 2],
        V_data[len(V_data) // 2],
        gas,
        ax=ax,
    )
ax.set_xscale("log")
ax.set_yscale("log")
ax.set_xlabel("Pressure x distance [Torr.cm]")
ax.set_ylabel("Breakdown voltage [V]")
ax.set_title(
    "Experimental breakdown voltage vs. pressure x distance.\nData from Raizer1991."
)
plt.show()
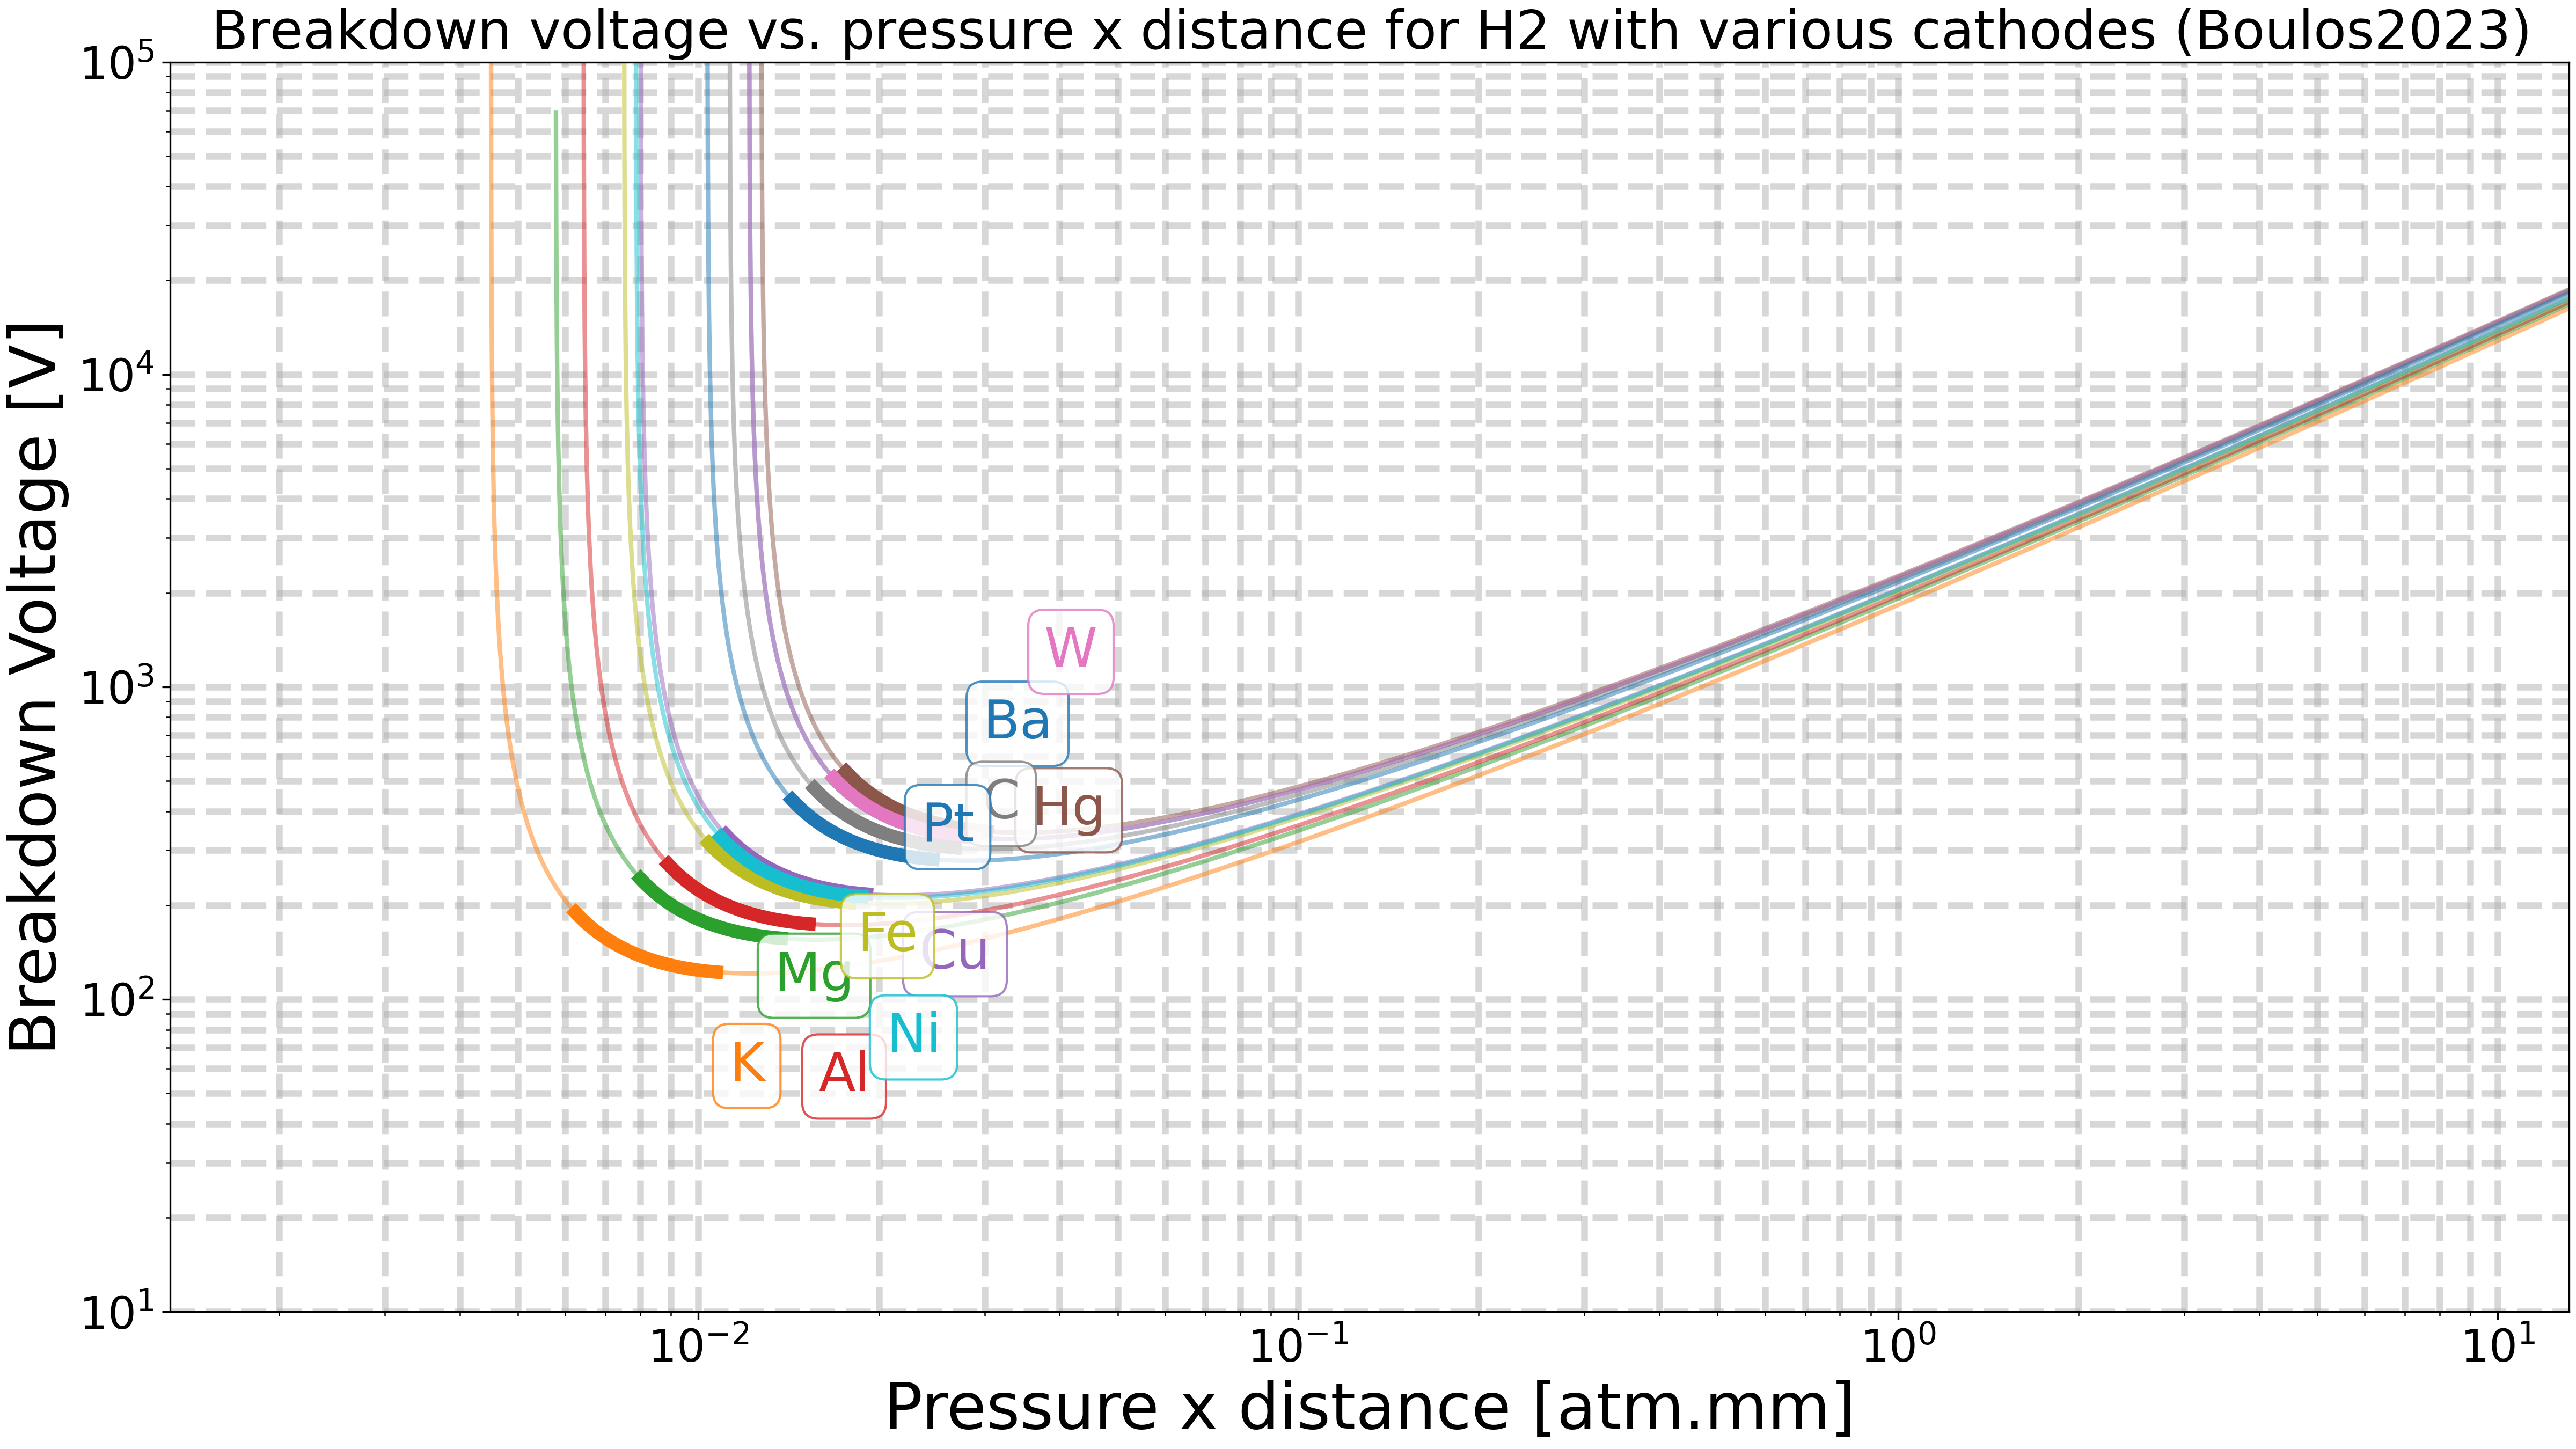
Plot the breakdown voltage vs pd for various cathode materials with hydrogen gas.#
units = "atm.mm" # "Torr.cm" or "atm.mm"
gas = "H2" # He, Ar, H2, H2O, CO2, Air, H2, CH4
cathodes = [
"Ba", # Barium (no data in Boulos2023, use `default_gamma_value_for_missing_data`)
"K", # Potassium
"Mg", # Magnesium
"Al", # Aluminum
"Cu", # Copper
"Hg", # Mercury
"W", # Tungsten (no data in Boulos2023, use `default_gamma_value_for_missing_data`)
"C", # Carbon
"Fe", # Iron
"Ni", # Nickel
"Pt", # Platinum
]
pd_range_min = 0.1 # [Torr.cm]
pd_range_max = 1000 # [Torr.cm]
nb_points = 10000
pd_range = np.geomspace(pd_range_min, pd_range_max, nb_points)
fig, ax = plt.subplots()
texts = []
for cathode in cathodes:
# Get the alpha and gamma coefficients for the given gas and cathode material.
alpha, gamma = get_townsend_coefficients(
gas,
cathode,
default_gamma_value_for_missing_data=1e-2,
use_default_gamma_for_missing_gas=True,
source_priority=["Boulos2023", "Raizer1991", "Korolov2016"],
)
# Create a Townsend breakdown discharge object.
discharge = TownsendBreakdownDischarge(alpha=alpha, gamma=gamma)
# Plot the breakdown voltage vs pd for this gas and cathode material.
fig, ax = discharge.plot_breakdown_voltage_vs_pd(
pd_range,
figax=(fig, ax),
units=units,
)
# Add an annotation for the cathode material at the minimum breakdown voltage.
min_voltage = discharge.get_min_breakdown_voltage(pd_range)
if np.isnan(min_voltage):
continue
min_voltage_index = np.nanargmin(discharge.get_breakdown_voltage(pd_range))
print(
f"Minimum breakdown voltage for {gas} with {cathode} cathode: "
f"{min_voltage:.2f} V at pd = {pd_range[min_voltage_index]:.2f} Torr.cm"
)
min_pd = pd_range[min_voltage_index]
text = get_text(
min_pd if units == "Torr.cm" else min_pd / 76,
min_voltage,
cathode,
ax=ax,
)
texts.append(text)
if units == "Torr.cm":
ax.set_xlim(pd_range_min, pd_range_max)
elif units == "atm.mm":
ax.set_xlim(pd_range_min / 76, pd_range_max / 76)
ax.set_ylim(10, 100_000)
ax.set_title(
"Breakdown voltage vs. pressure x distance.\n"
rf"For $\mathrm{{{gas}}}$ with various cathodes (Boulos2023)"
)
adjust_text(texts, ax=ax, max_move=100, explode_radius=100)
# Plot two red arrows.
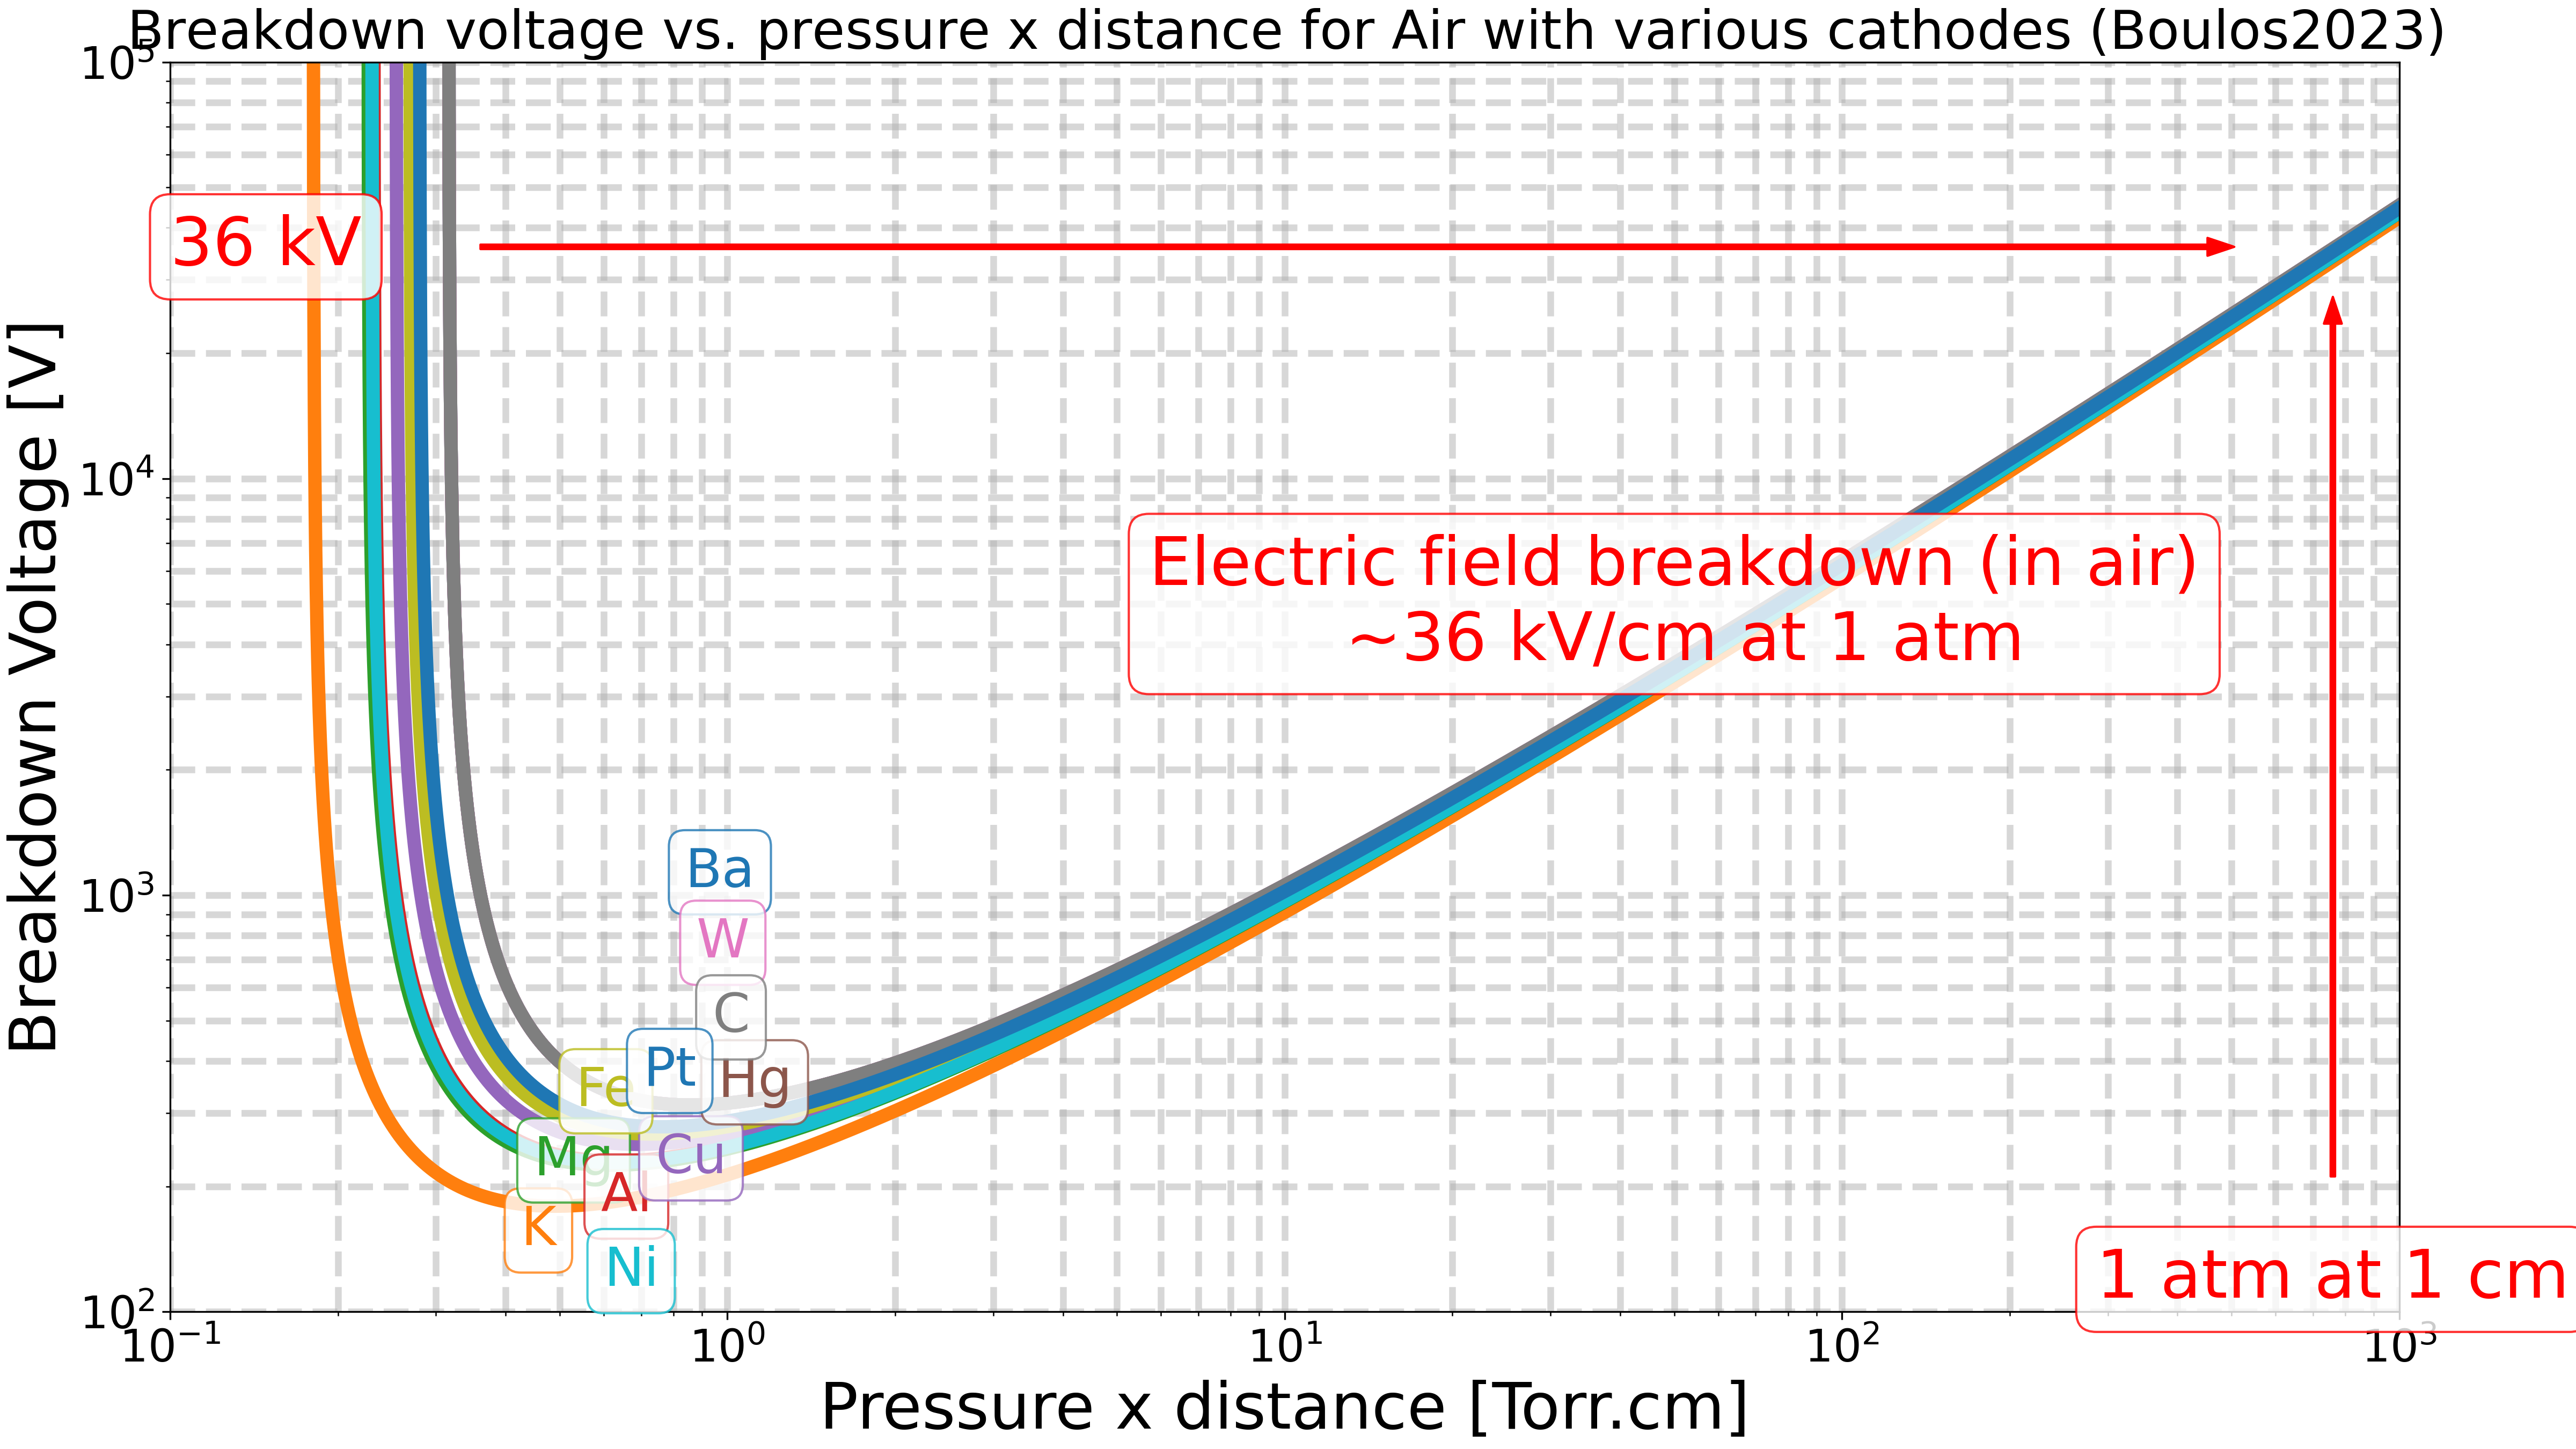
if gas == "Air":
# One vertical arrow at pd = 760 Torr.cm pointing up with the text "1 atm at 1 cm" below it.
ax.annotate(
"1 atm at 1 cm",
xy=(760, 36_000),
xytext=(760, 100),
arrowprops=dict(color="red", shrink=0.05, width=2, headwidth=8),
fontsize=30,
ha="center",
va="bottom",
color="red",
bbox=dict(facecolor="white", alpha=0.8, edgecolor="red", boxstyle="round"),
)
# One horizontal arrow at V = 36e3 V pointing left with the text "36 kV" to the left of it.
ax.annotate(
"36 kV",
xy=(760, 36_000),
xytext=(1e-1, 36_000),
arrowprops=dict(color="red", shrink=0.05, width=2, headwidth=8),
fontsize=30,
ha="left",
va="center",
color="red",
bbox=dict(facecolor="white", alpha=0.8, edgecolor="red", boxstyle="round"),
)
# Text saying electric breakdown ~36 kV/cm at 1 atm.
get_text(
50,
5_000,
"Electric field breakdown (in air)\n ~36 kV/cm at 1 atm",
ax=ax,
color="red",
)
plt.show()
/home/runner/work/rizer/rizer/examples/plasma/plot_townsend_discharge.py:107: UserWarning: Missing gamma coefficient data for gas `H2` and cathode material `Ba`. Using explicit default gamma value 0.01.
  alpha, gamma = get_townsend_coefficients(
Minimum breakdown voltage for H2 with Ba cathode: 326.18 V at pd = 2.51 Torr.cm
Minimum breakdown voltage for H2 with K cathode: 121.07 V at pd = 0.93 Torr.cm
Minimum breakdown voltage for H2 with Mg cathode: 155.29 V at pd = 1.19 Torr.cm
Minimum breakdown voltage for H2 with Al cathode: 172.78 V at pd = 1.33 Torr.cm
Minimum breakdown voltage for H2 with Cu cathode: 215.17 V at pd = 1.66 Torr.cm
Minimum breakdown voltage for H2 with Hg cathode: 341.81 V at pd = 2.63 Torr.cm
/home/runner/work/rizer/rizer/examples/plasma/plot_townsend_discharge.py:107: UserWarning: Missing gamma coefficient data for gas `H2` and cathode material `W`. Using explicit default gamma value 0.01.
  alpha, gamma = get_townsend_coefficients(
Minimum breakdown voltage for H2 with W cathode: 326.18 V at pd = 2.51 Torr.cm
Minimum breakdown voltage for H2 with C cathode: 302.67 V at pd = 2.33 Torr.cm
Minimum breakdown voltage for H2 with Fe cathode: 201.86 V at pd = 1.55 Torr.cm
Minimum breakdown voltage for H2 with Ni cathode: 211.26 V at pd = 1.63 Torr.cm
Minimum breakdown voltage for H2 with Pt cathode: 277.88 V at pd = 2.14 Torr.cm
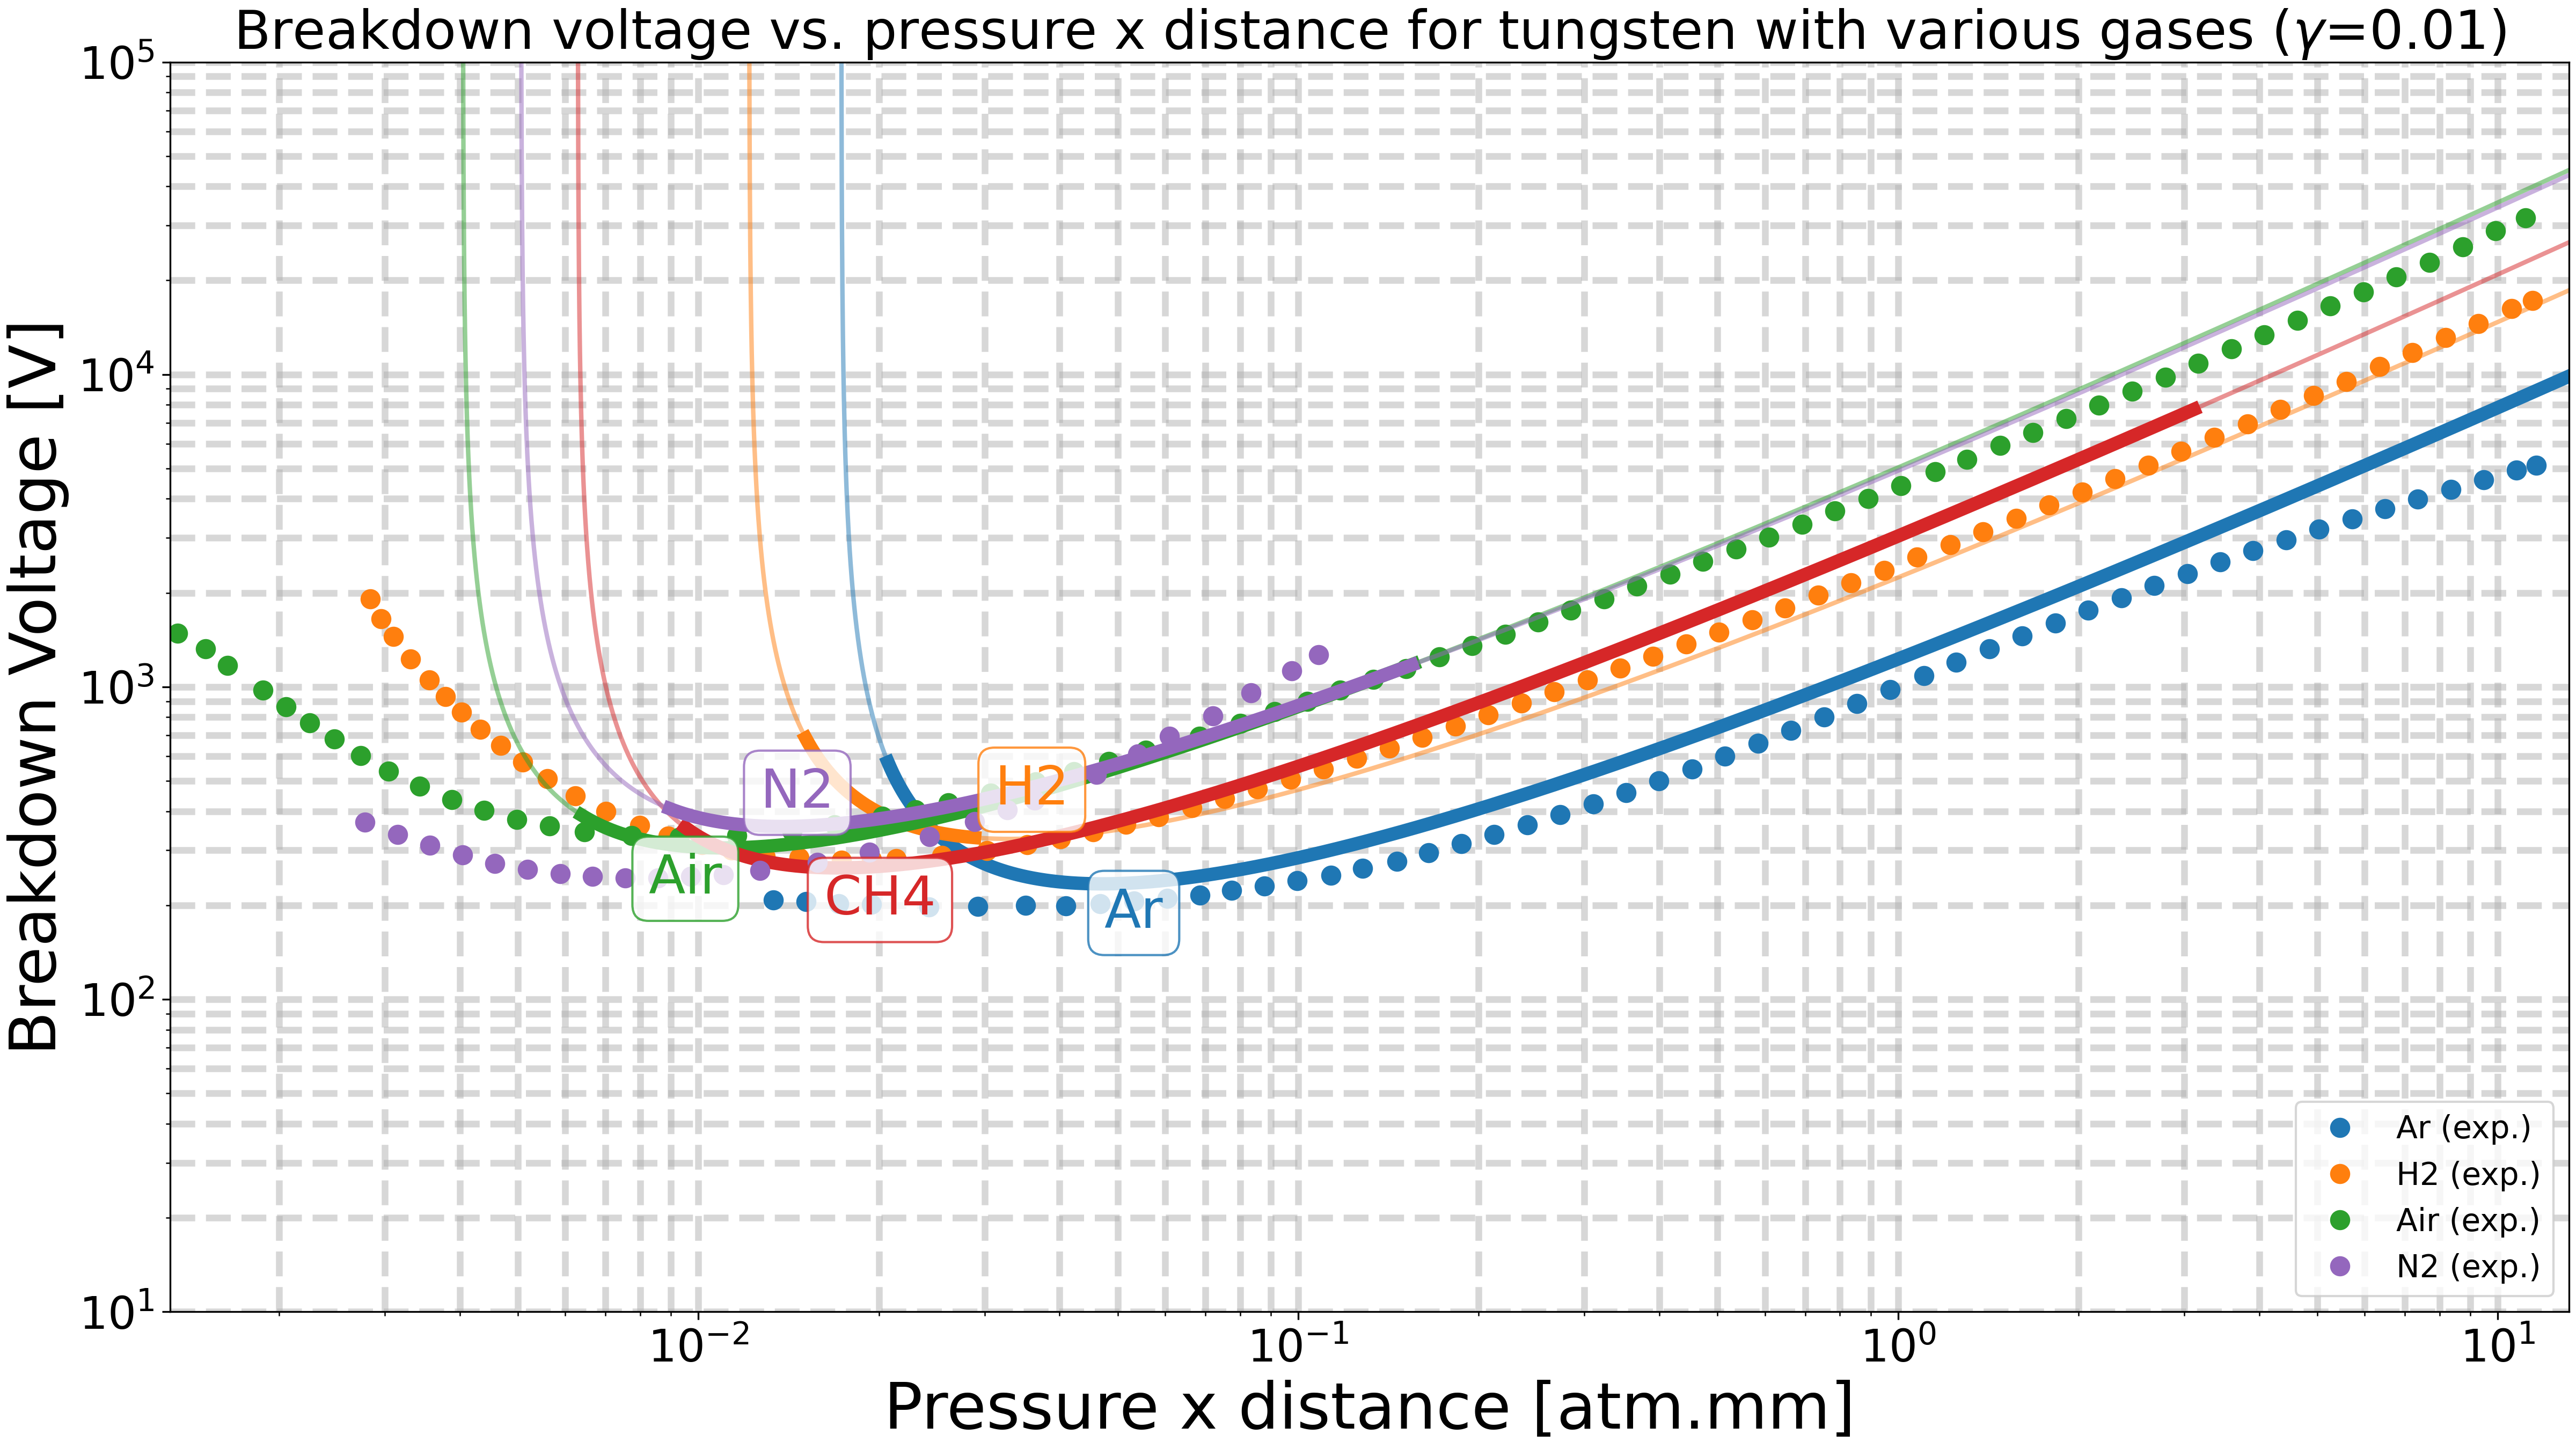
Plot the breakdown voltage vs pd for various gases with a tungsten cathode.#
units = "atm.mm"  # "Torr.cm" or "atm.mm"

gases = [
    "Ar",
    "H2",
    "Air",
    "CH4",
    "N2",
]

cathode = "W"  # Tungsten
pd_range_min = 0.1  # [Torr.cm]
pd_range_max = 1000  # [Torr.cm]
nb_points = 10000
default_gamma_value_for_missing_data = 1e-2
pd_range = np.geomspace(pd_range_min, pd_range_max, nb_points)


fig, ax = plt.subplots()
texts = []

for gas in gases:
    # Get the alpha and gamma coefficients for the given gas and cathode material.
    alpha, gamma = get_townsend_coefficients(
        gas,
        cathode,
        default_gamma_value_for_missing_data=default_gamma_value_for_missing_data,
        use_default_gamma_for_missing_gas=True,
        source_priority=["Korolov2016", "Raizer1991", "Boulos2023"],
    )
    # Create a Townsend breakdown discharge object.
    discharge = TownsendBreakdownDischarge(alpha=alpha, gamma=gamma)
    # Plot the breakdown voltage vs pd for this gas and cathode material.
    fig, ax = discharge.plot_breakdown_voltage_vs_pd(
        pd_range,
        figax=(fig, ax),
        units=units,
    )

    # Also plot the experimental data for this gas if available.
    if gas in dict_experimental_data:
        pd_data, V_data = dict_experimental_data[gas]
        if units == "atm.mm":
            pd_data = pd_data / 76  # Convert from Torr.cm to atm.mm
        ax.plot(
            pd_data,
            V_data,
            "o",
            label=f"{gas} (exp.)",
            markersize=8,
            color=ax.lines[-1].get_color(),
        )

    # Add an annotation for the cathode material at the minimum breakdown voltage.
    min_voltage = discharge.get_min_breakdown_voltage(pd_range)
    if np.isnan(min_voltage):
        continue
    min_voltage_index = np.nanargmin(discharge.get_breakdown_voltage(pd_range))
    min_pd = pd_range[min_voltage_index]
    text = get_text(
        min_pd if units == "Torr.cm" else min_pd / 76,
        min_voltage,
        gas,
        ax=ax,
    )
    texts.append(text)

if units == "Torr.cm":
    ax.set_xlim(pd_range_min, pd_range_max)
elif units == "atm.mm":
    ax.set_xlim(pd_range_min / 76, pd_range_max / 76)
ax.set_ylim(10, 100_000)
ax.set_title(
    "Breakdown voltage vs. pressure x distance.\n"
    "For tungsten with various gases."
    r"($\gamma$"
    f"={default_gamma_value_for_missing_data})"
)
ax.legend(loc="lower right", fontsize=14)
adjust_text(texts, ax=ax, max_move=100, explode_radius=100)

plt.show()
/home/runner/work/rizer/rizer/examples/plasma/plot_townsend_discharge.py:216: UserWarning: Missing gamma coefficient data for gas `Ar` and cathode material `W`. Using explicit default gamma value 0.01.
  alpha, gamma = get_townsend_coefficients(
/home/runner/work/rizer/rizer/examples/plasma/plot_townsend_discharge.py:216: UserWarning: Missing gamma coefficient data for gas `H2` and cathode material `W`. Using explicit default gamma value 0.01.
  alpha, gamma = get_townsend_coefficients(
/home/runner/work/rizer/rizer/examples/plasma/plot_townsend_discharge.py:216: UserWarning: Missing gamma coefficient data for gas `Air` and cathode material `W`. Using explicit default gamma value 0.01.
  alpha, gamma = get_townsend_coefficients(
/home/runner/work/rizer/rizer/examples/plasma/plot_townsend_discharge.py:216: UserWarning: Missing gamma coefficient data for gas `CH4` and cathode material `W`. Using explicit default gamma value 0.01.
  alpha, gamma = get_townsend_coefficients(
/home/runner/work/rizer/rizer/examples/plasma/plot_townsend_discharge.py:216: UserWarning: Missing gamma coefficient data for gas `N2` and cathode material `W`. Using explicit default gamma value 0.01.
  alpha, gamma = get_townsend_coefficients(
Total running time of the script: (0 minutes 4.286 seconds)