—
Compare thermal conductivity vs. temperature for a plasma of methane.#
This example plots the thermal conductivity of methane as a function of temperature at 1 atm, comparing the results obtained from Cantera with reference data from the literature.
The thermal conductivity of methane is computed using both the multicomponent and mixture-averaged transport models in Cantera.
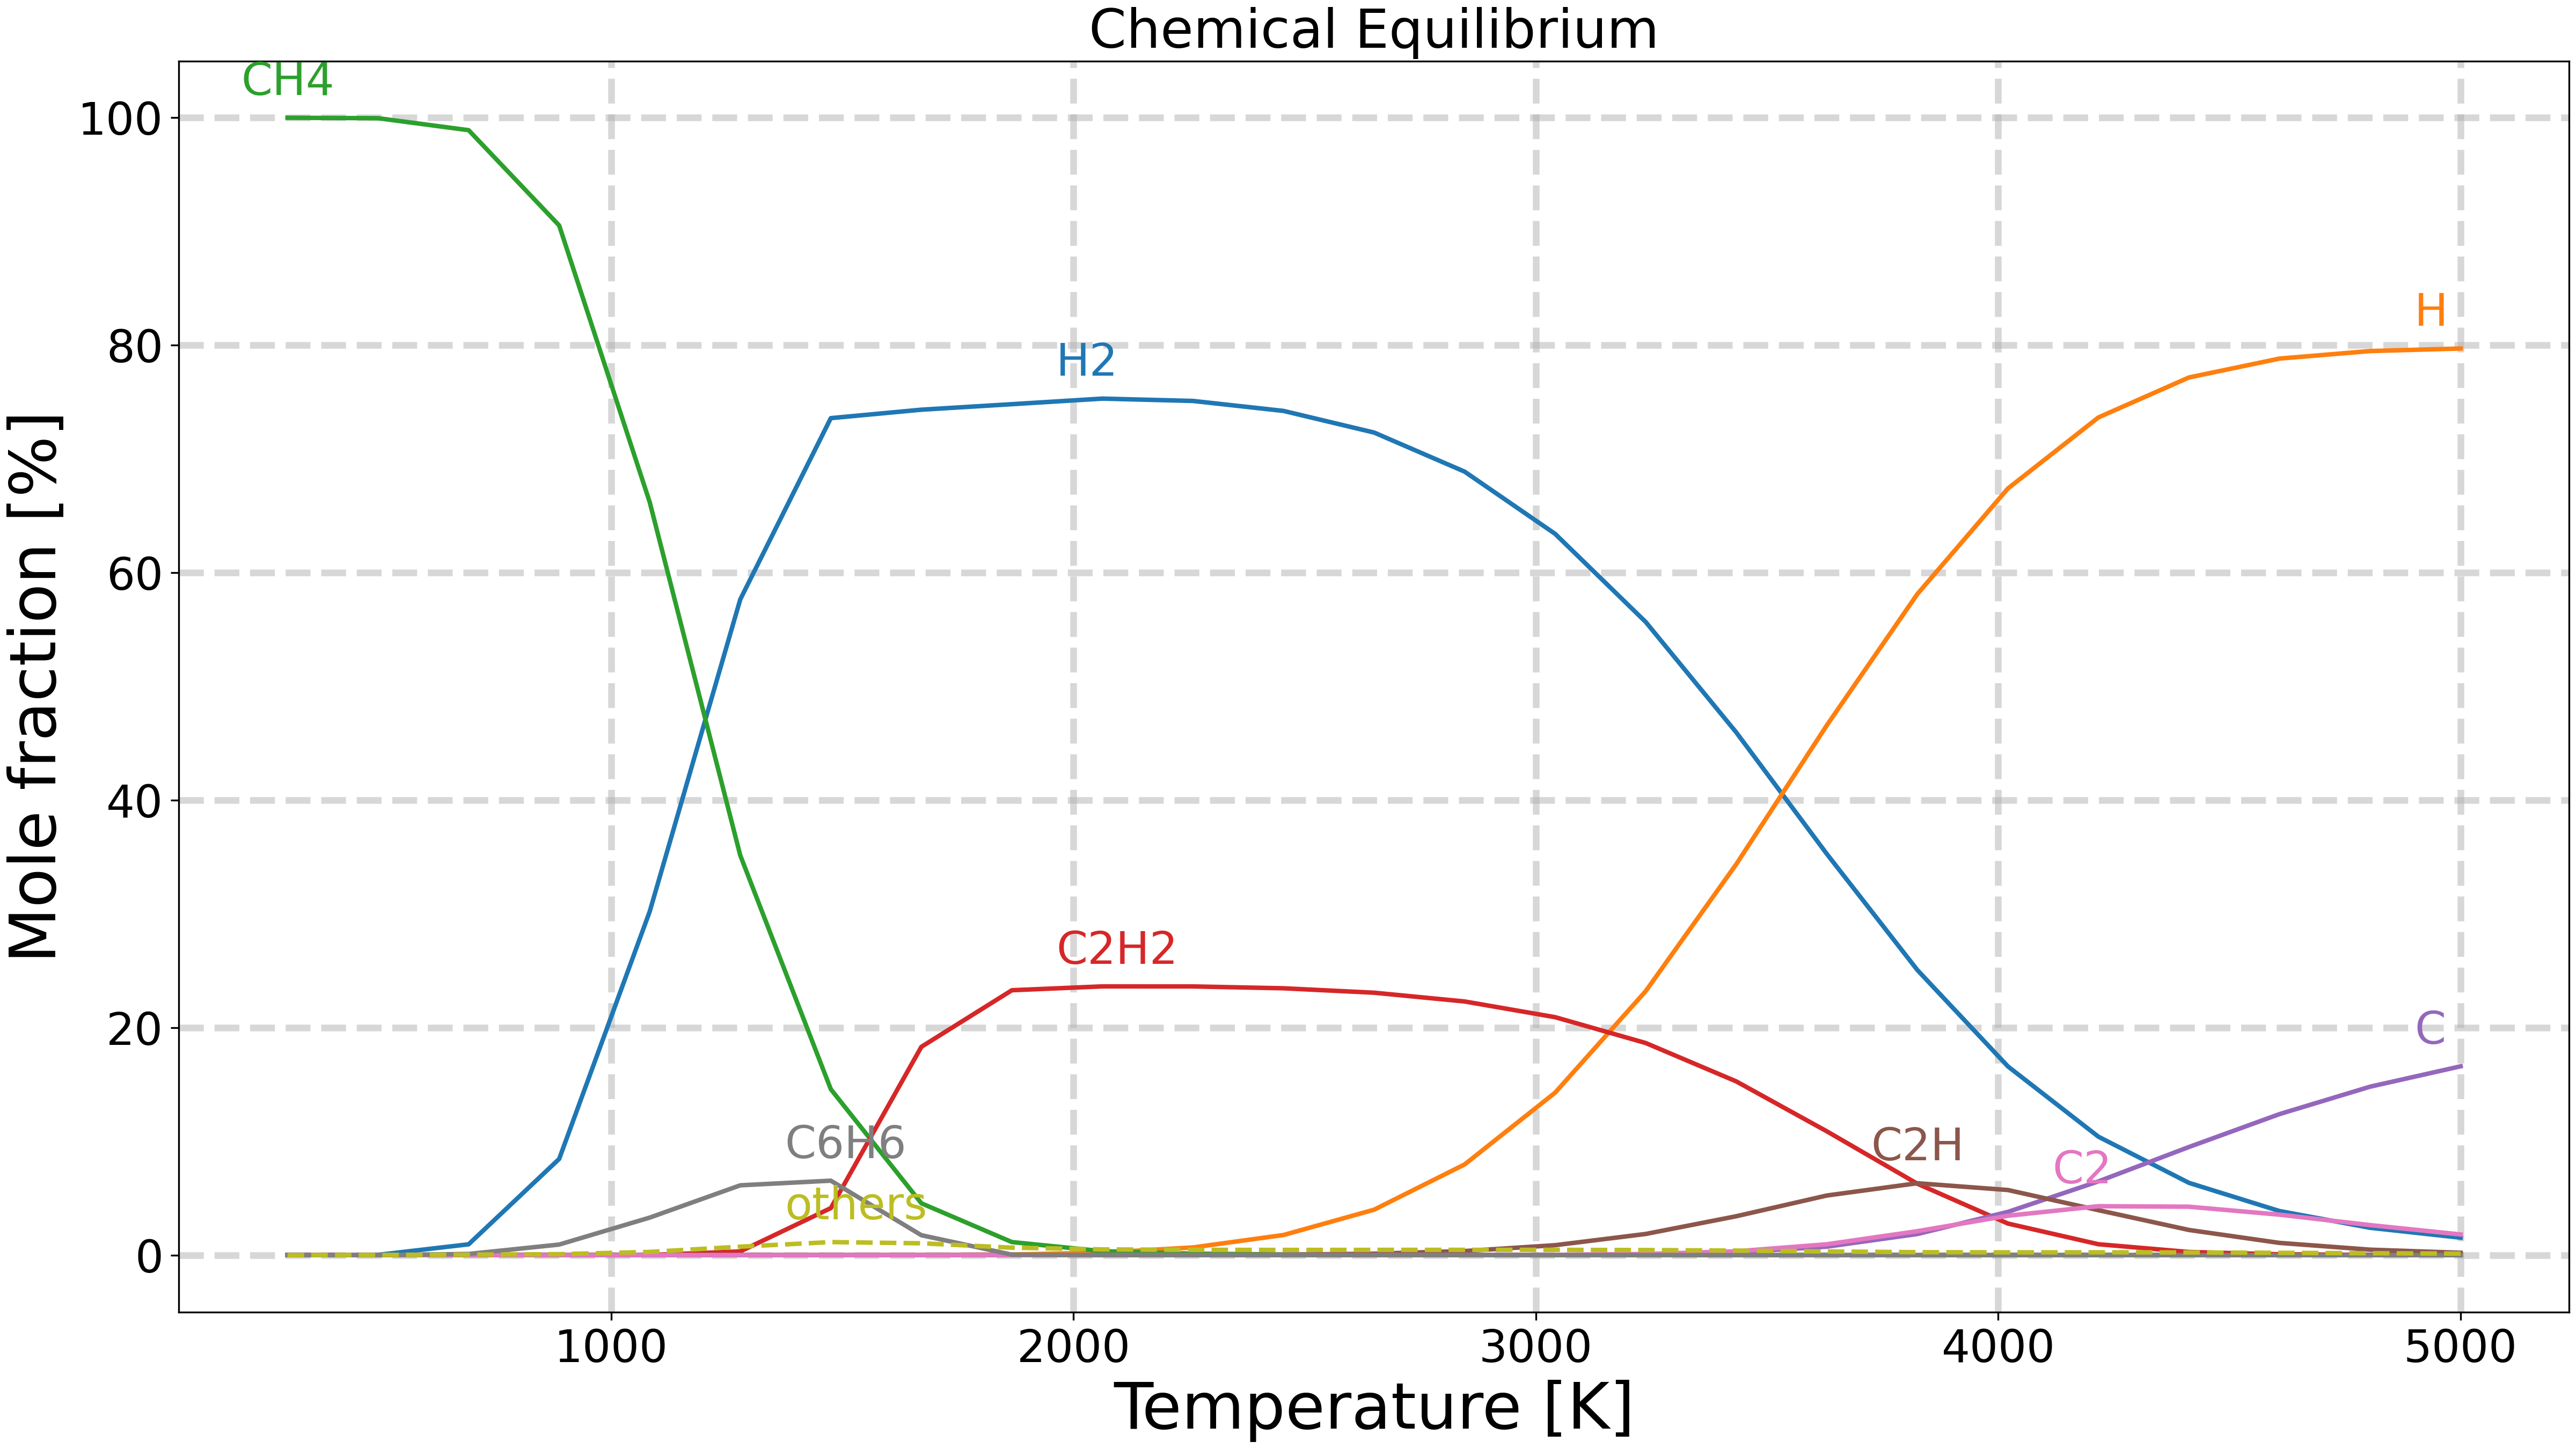
Equilibrium composition#
The following species are considered in the mechanism:
H, H2, C, CH, CH2, CH3, CH4, C2, C2H, C2H2, C2H3, C2H4, C2H5, C2H6, C6H6
Transport data are taken from the [Chemkin] transport database (see ./data/mechanisms/transport/transport.csv).
References data#
The reference data for the thermal conductivity of methane at 1 atm are taken from:
Import the required libraries.#
import cantera as ct
import matplotlib.pyplot as plt
import numpy as np

from rizer.io.thermo_transport_data_reader import ThermoTransportDataReader
from rizer.misc.ct_utils import plot_chemical_equilibrium
from rizer.misc.plt_utils import set_mpl_style
from rizer.misc.utils import get_path_to_data

set_mpl_style(nb_columns=1)
Load reference data.#
thermo_with_transport = get_path_to_data(
    "mechanisms/thermo/grc_nasa9_C_H_transport.yaml"
)
gas_multicomponent = ct.Solution(
    thermo_with_transport, transport_model="multicomponent"
)
gas_mixture_averaged = ct.Solution(
    thermo_with_transport, transport_model="mixture-averaged"
)

data_CH4_Wu2016_Niu2016 = ThermoTransportDataReader(
    gas_name="CH4", pressure_atm=1, source="Wu2016_Niu2016", ignore_missing_values=True
)
data_CH4_minplascalc = ThermoTransportDataReader(
    gas_name="CH4", pressure_atm=1, source="minplascalc"
)
Compute the thermal conductivity of methane using Cantera.#
temperatures_ct = np.linspace(300, 5000, 25)
kappa_multicomponent = []
kappa_mixture_averaged = []
for T in temperatures_ct:
    # Set the state of the gas to the desired temperature, pressure, and composition.
    gas_multicomponent.TPX = T, ct.one_atm, "CH4:1"
    gas_mixture_averaged.TPX = T, ct.one_atm, "CH4:1"

    # Equilibrate the gas at constant temperature and pressure.
    gas_multicomponent.equilibrate("TP")
    gas_mixture_averaged.equilibrate("TP")

    # Compute the thermal conductivity.
    kappa_multicomponent.append(gas_multicomponent.thermal_conductivity)
    kappa_mixture_averaged.append(gas_mixture_averaged.thermal_conductivity)

plot_chemical_equilibrium(
    thermo_with_transport,
    initial_solution="CH4:1",
    temperatures=temperatures_ct,
    keep_only_first_species=8,
)
Plot the thermal conductivity vs. temperature.#
fig, ax = data_CH4_Wu2016_Niu2016.plot(
    x="T",
    y="kappa",
    show=False,
    label="Wu2016_Niu2016",
    ls="-",
    lw=4,
    color="black",
)
data_CH4_minplascalc.plot(
    x="T",
    y="kappa",
    fig_ax=(fig, ax),
    show=False,
    label="MinPlasCalc",
    ls="--",
    lw=3,
    color="red",
)

ax.scatter(
    temperatures_ct,
    kappa_multicomponent,
    label="Cantera (multicomponent)",
    ls="-",
    lw=2,
    color="blue",
)
ax.scatter(
    temperatures_ct,
    kappa_mixture_averaged,
    label="Cantera (mixture-averaged)",
    ls="-",
    lw=2,
    color="cyan",
)

ax.legend(loc="best")

ax.set_xlim(300, 5000)
ax.set_ylim(1e-2, 30)
ax.set_yscale("log")

plt.show()
![Thermal conductivity $\mathregular{[W.m^{-1}.K^{-1}]}$ vs. Temperature $\mathregular{[K]}$, Gas: CH4, pressure: 1 atm, Source: minplascalc](../../_images/sphx_glr_plot_compare_methane_thermal_conductivity_in_LTE_002.png)
Total running time of the script: (0 minutes 1.109 seconds)